Graphs
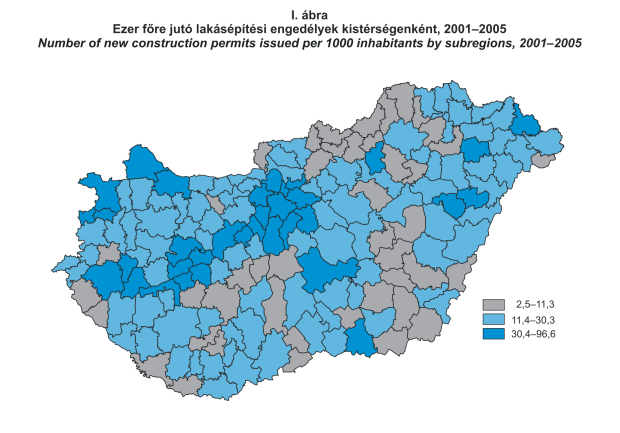
- Number of new construction permits issued per 1000 inhabitants by subregions, 2001–2005
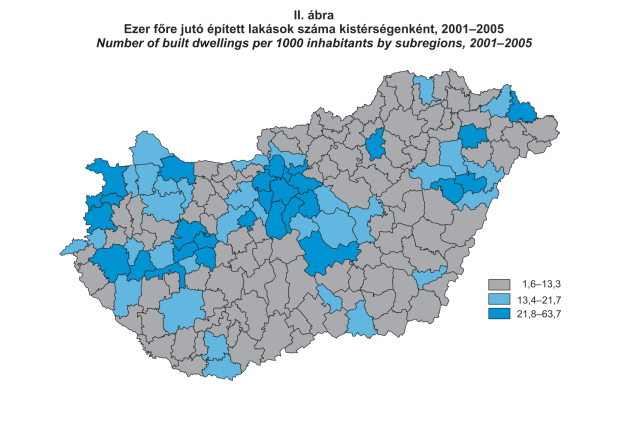
- Number of built dwellings per 1000 inhabitants by subregions, 2001–2005
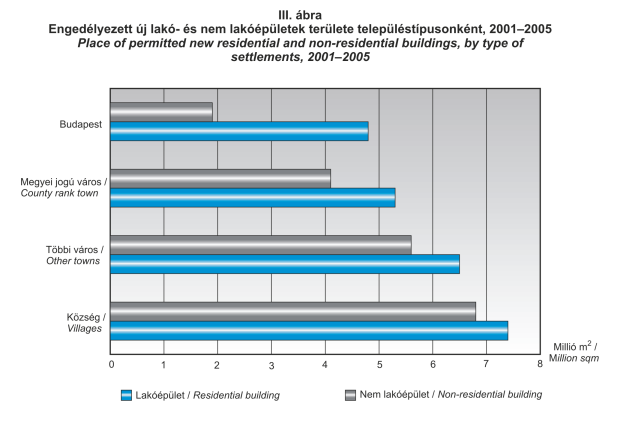
- Place of permitted new residential and non-residential buildings, by settlement types, 2001–2005
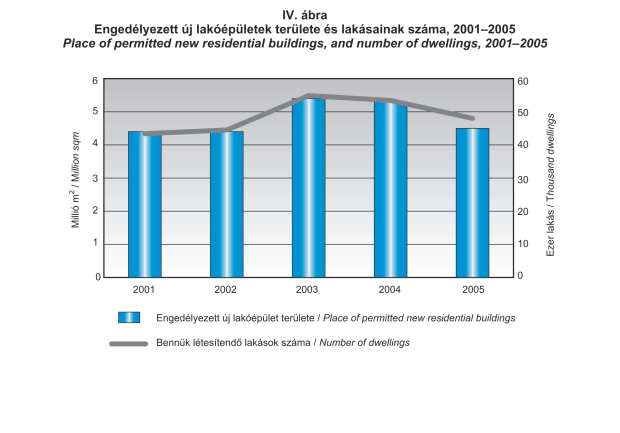
- Place of permitted new residential bulidings, and number of dwellings, 2001–2005
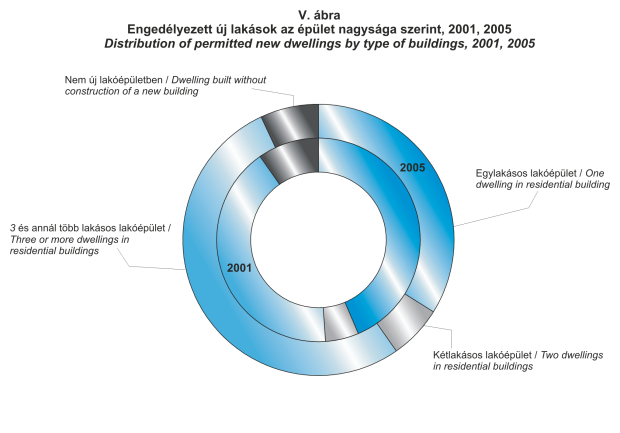
- Distribution of permitted new dwellings by type of buildings, 2001, 2005
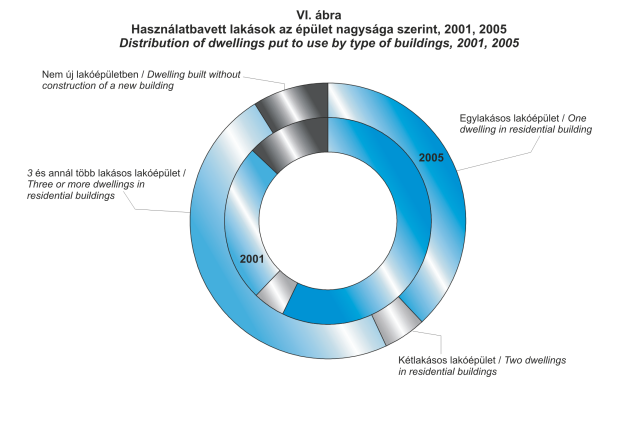
- Distribution of dwellings put to use by type of buildings, 2001, 2005
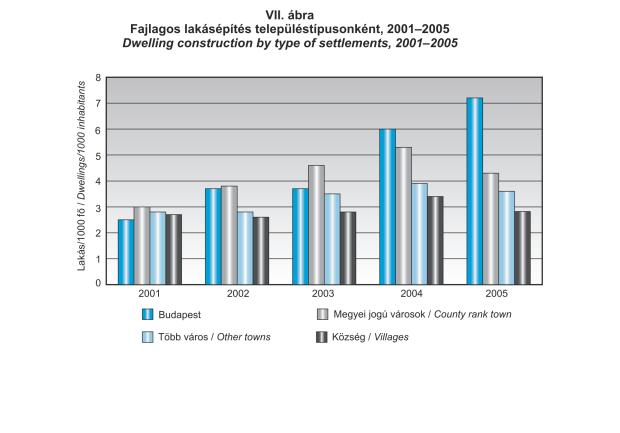
- Dwelling construction by type of settlements 2001–2005
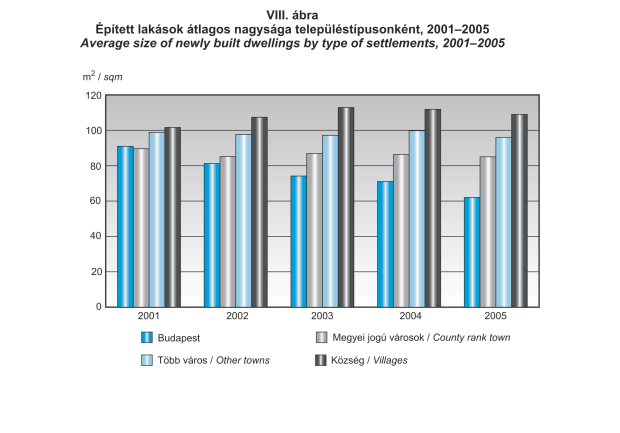
- Average size of newly built dwellings by type of settlements 2001–2005
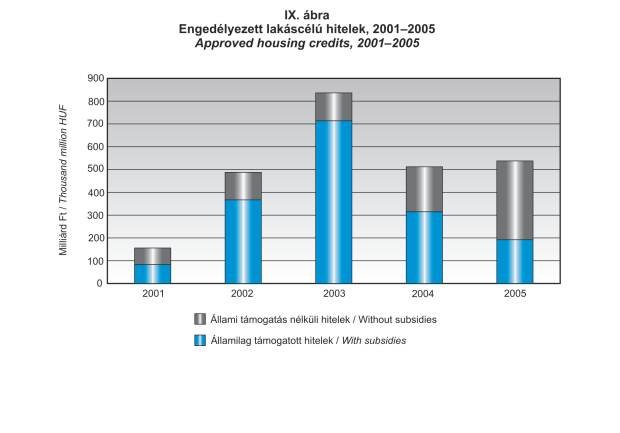
- Approved housing credits, 2001–2005
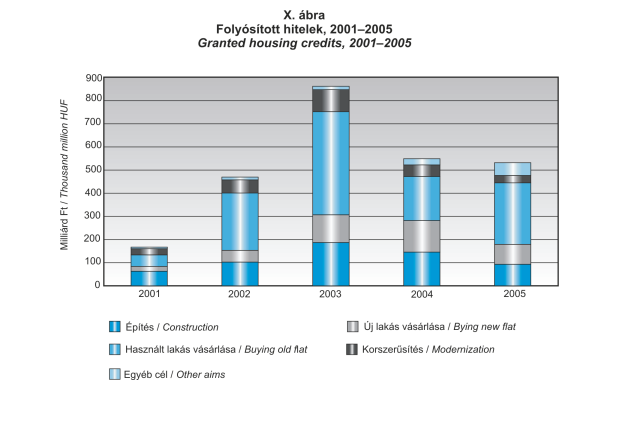
- Granted housing credits, 2001–2005
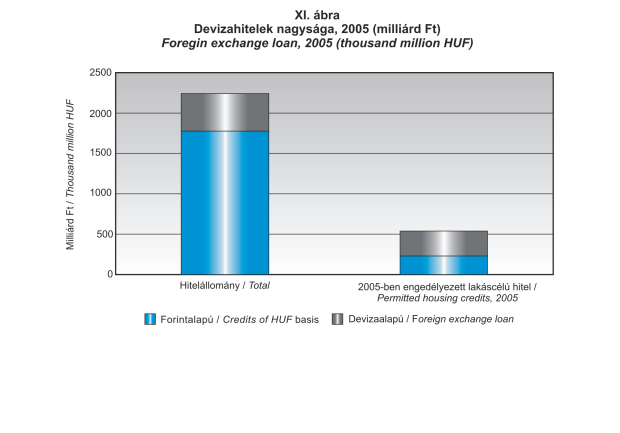
- Foregin exchange loan, 2005
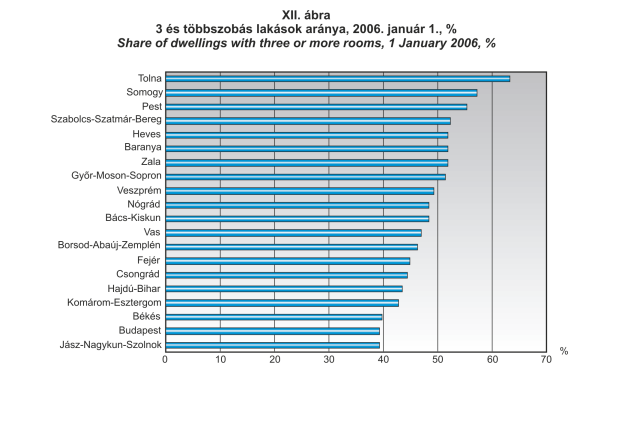
- Share of dwellings with three or more rooms, 1.I.2006. %
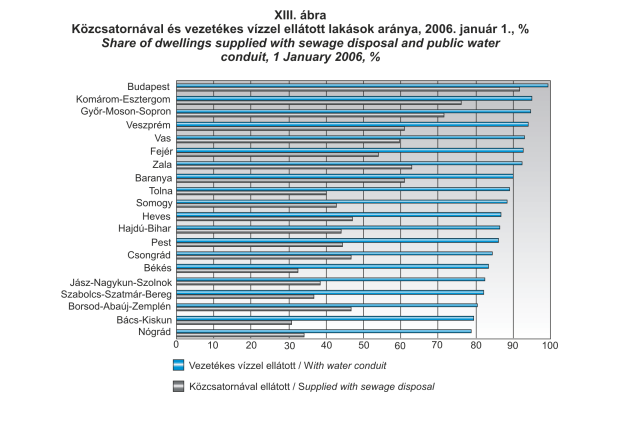
- Share of dwellings supplied with sewage disposal and public water conduit, 1.I.2006. %
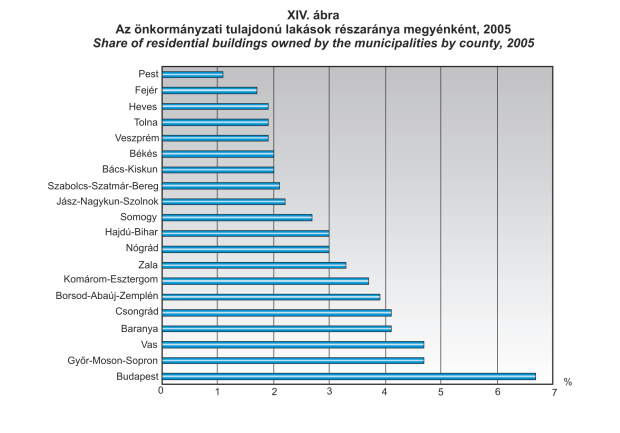
- Share of dwellings owned by the municipalities by county, 2005
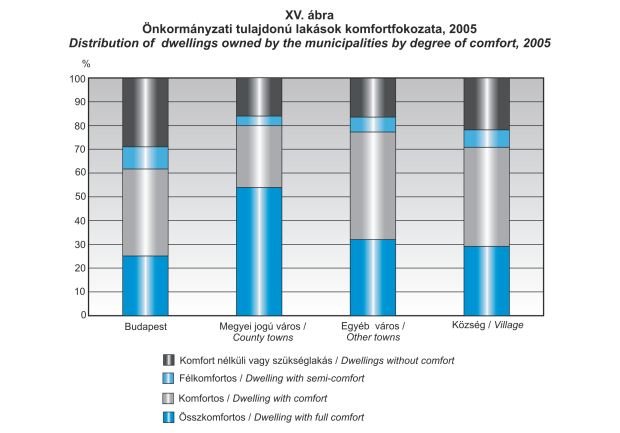
- Distribution of dwellings owned by the municipalities by degree of comfort, by settlement types, 2005
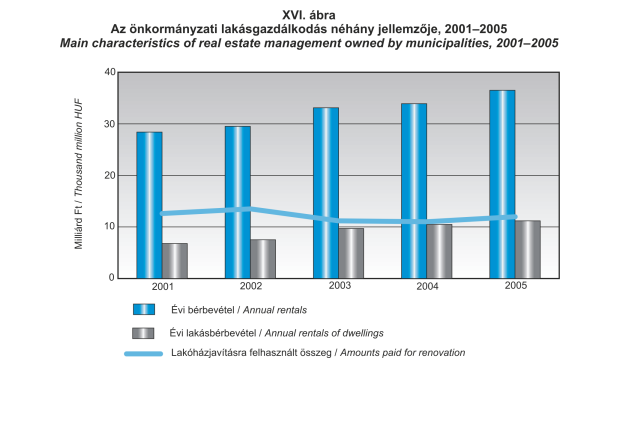
- Main characteristics of real estate management owned by municipalities, 2001–2005
« Back