
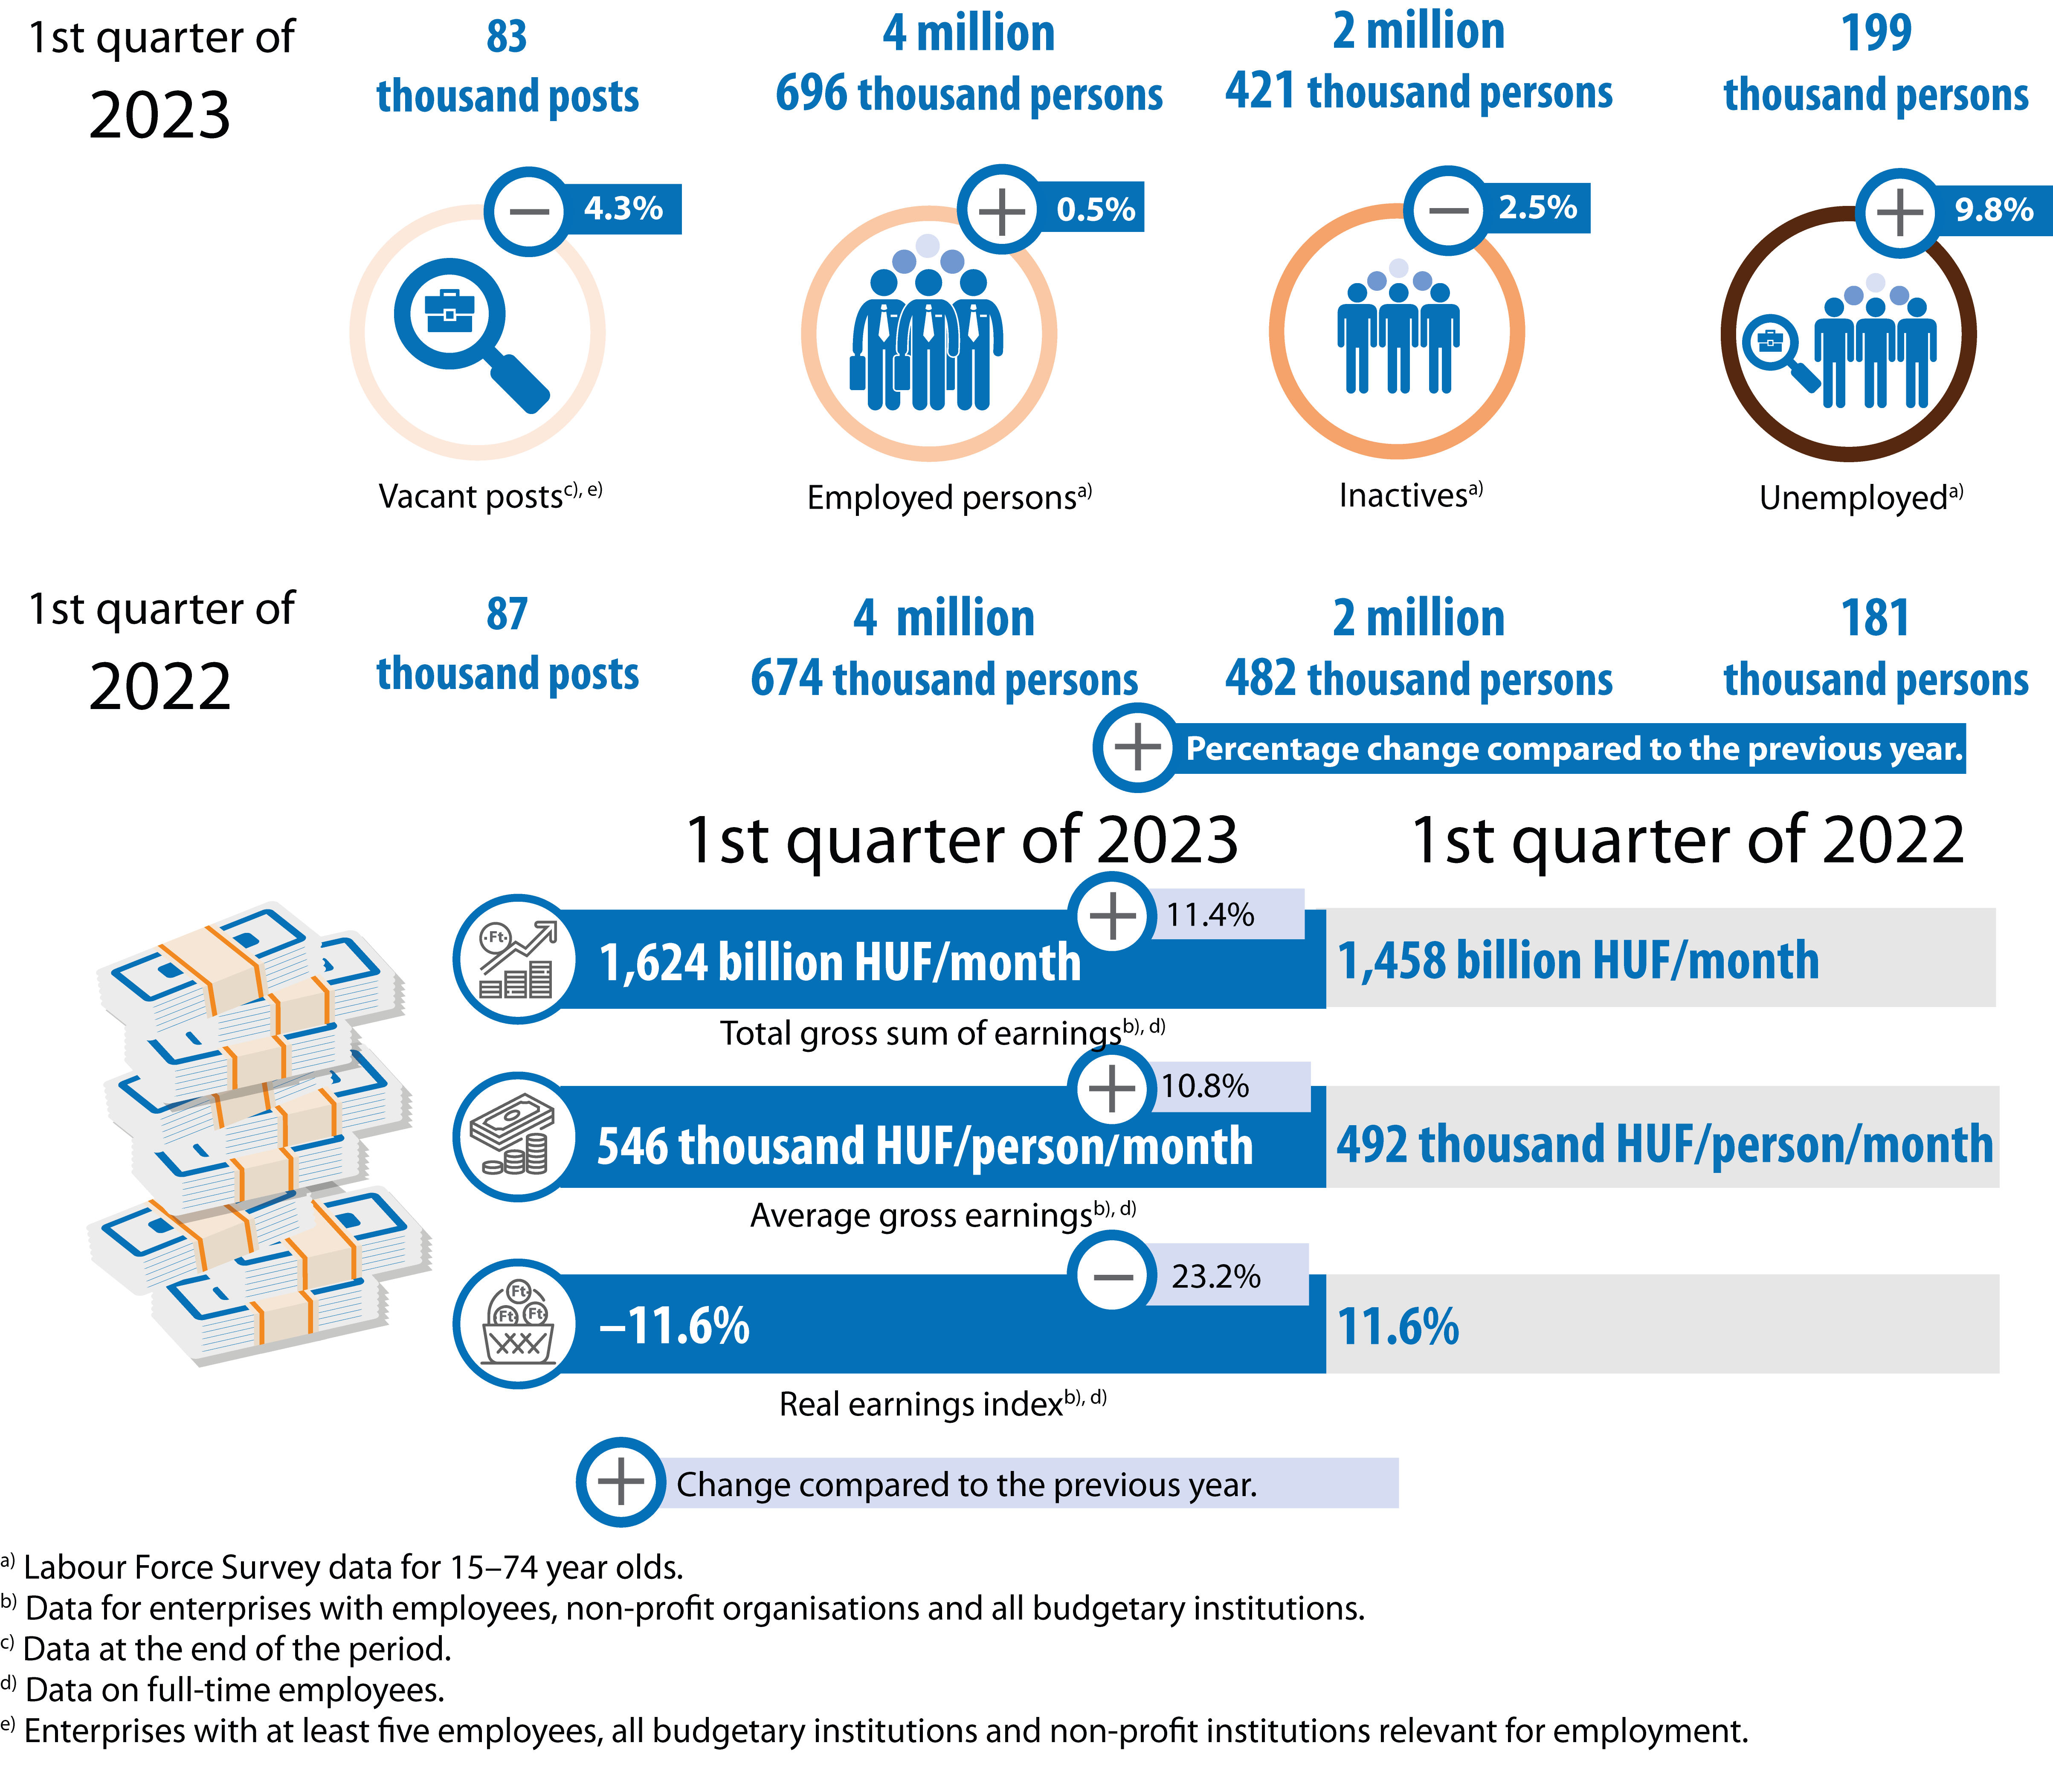
In the first quarter of 2023, employment continued to expand year-on-year, mainly due to a pick-up in the primary labour market and an increase in foreign employment. The average number of employed persons in the population aged 15-74 was 4 million 696 thousand, 21 thousand more than in Q1 2022. The number of the unemployed increased by 18 thousand to 199 thousand. The size of the potentially available labour force did not change, but its composition did. The demand for additional labour has decreased. The purchasing power of earnings fell due to high inflation.
Slight increase in employment
In the first quarter of 2023, the average number of employed persons in the population aged 15-74 was 4 million 696 thousand, 21 thousand more than in the same period of the previous year.
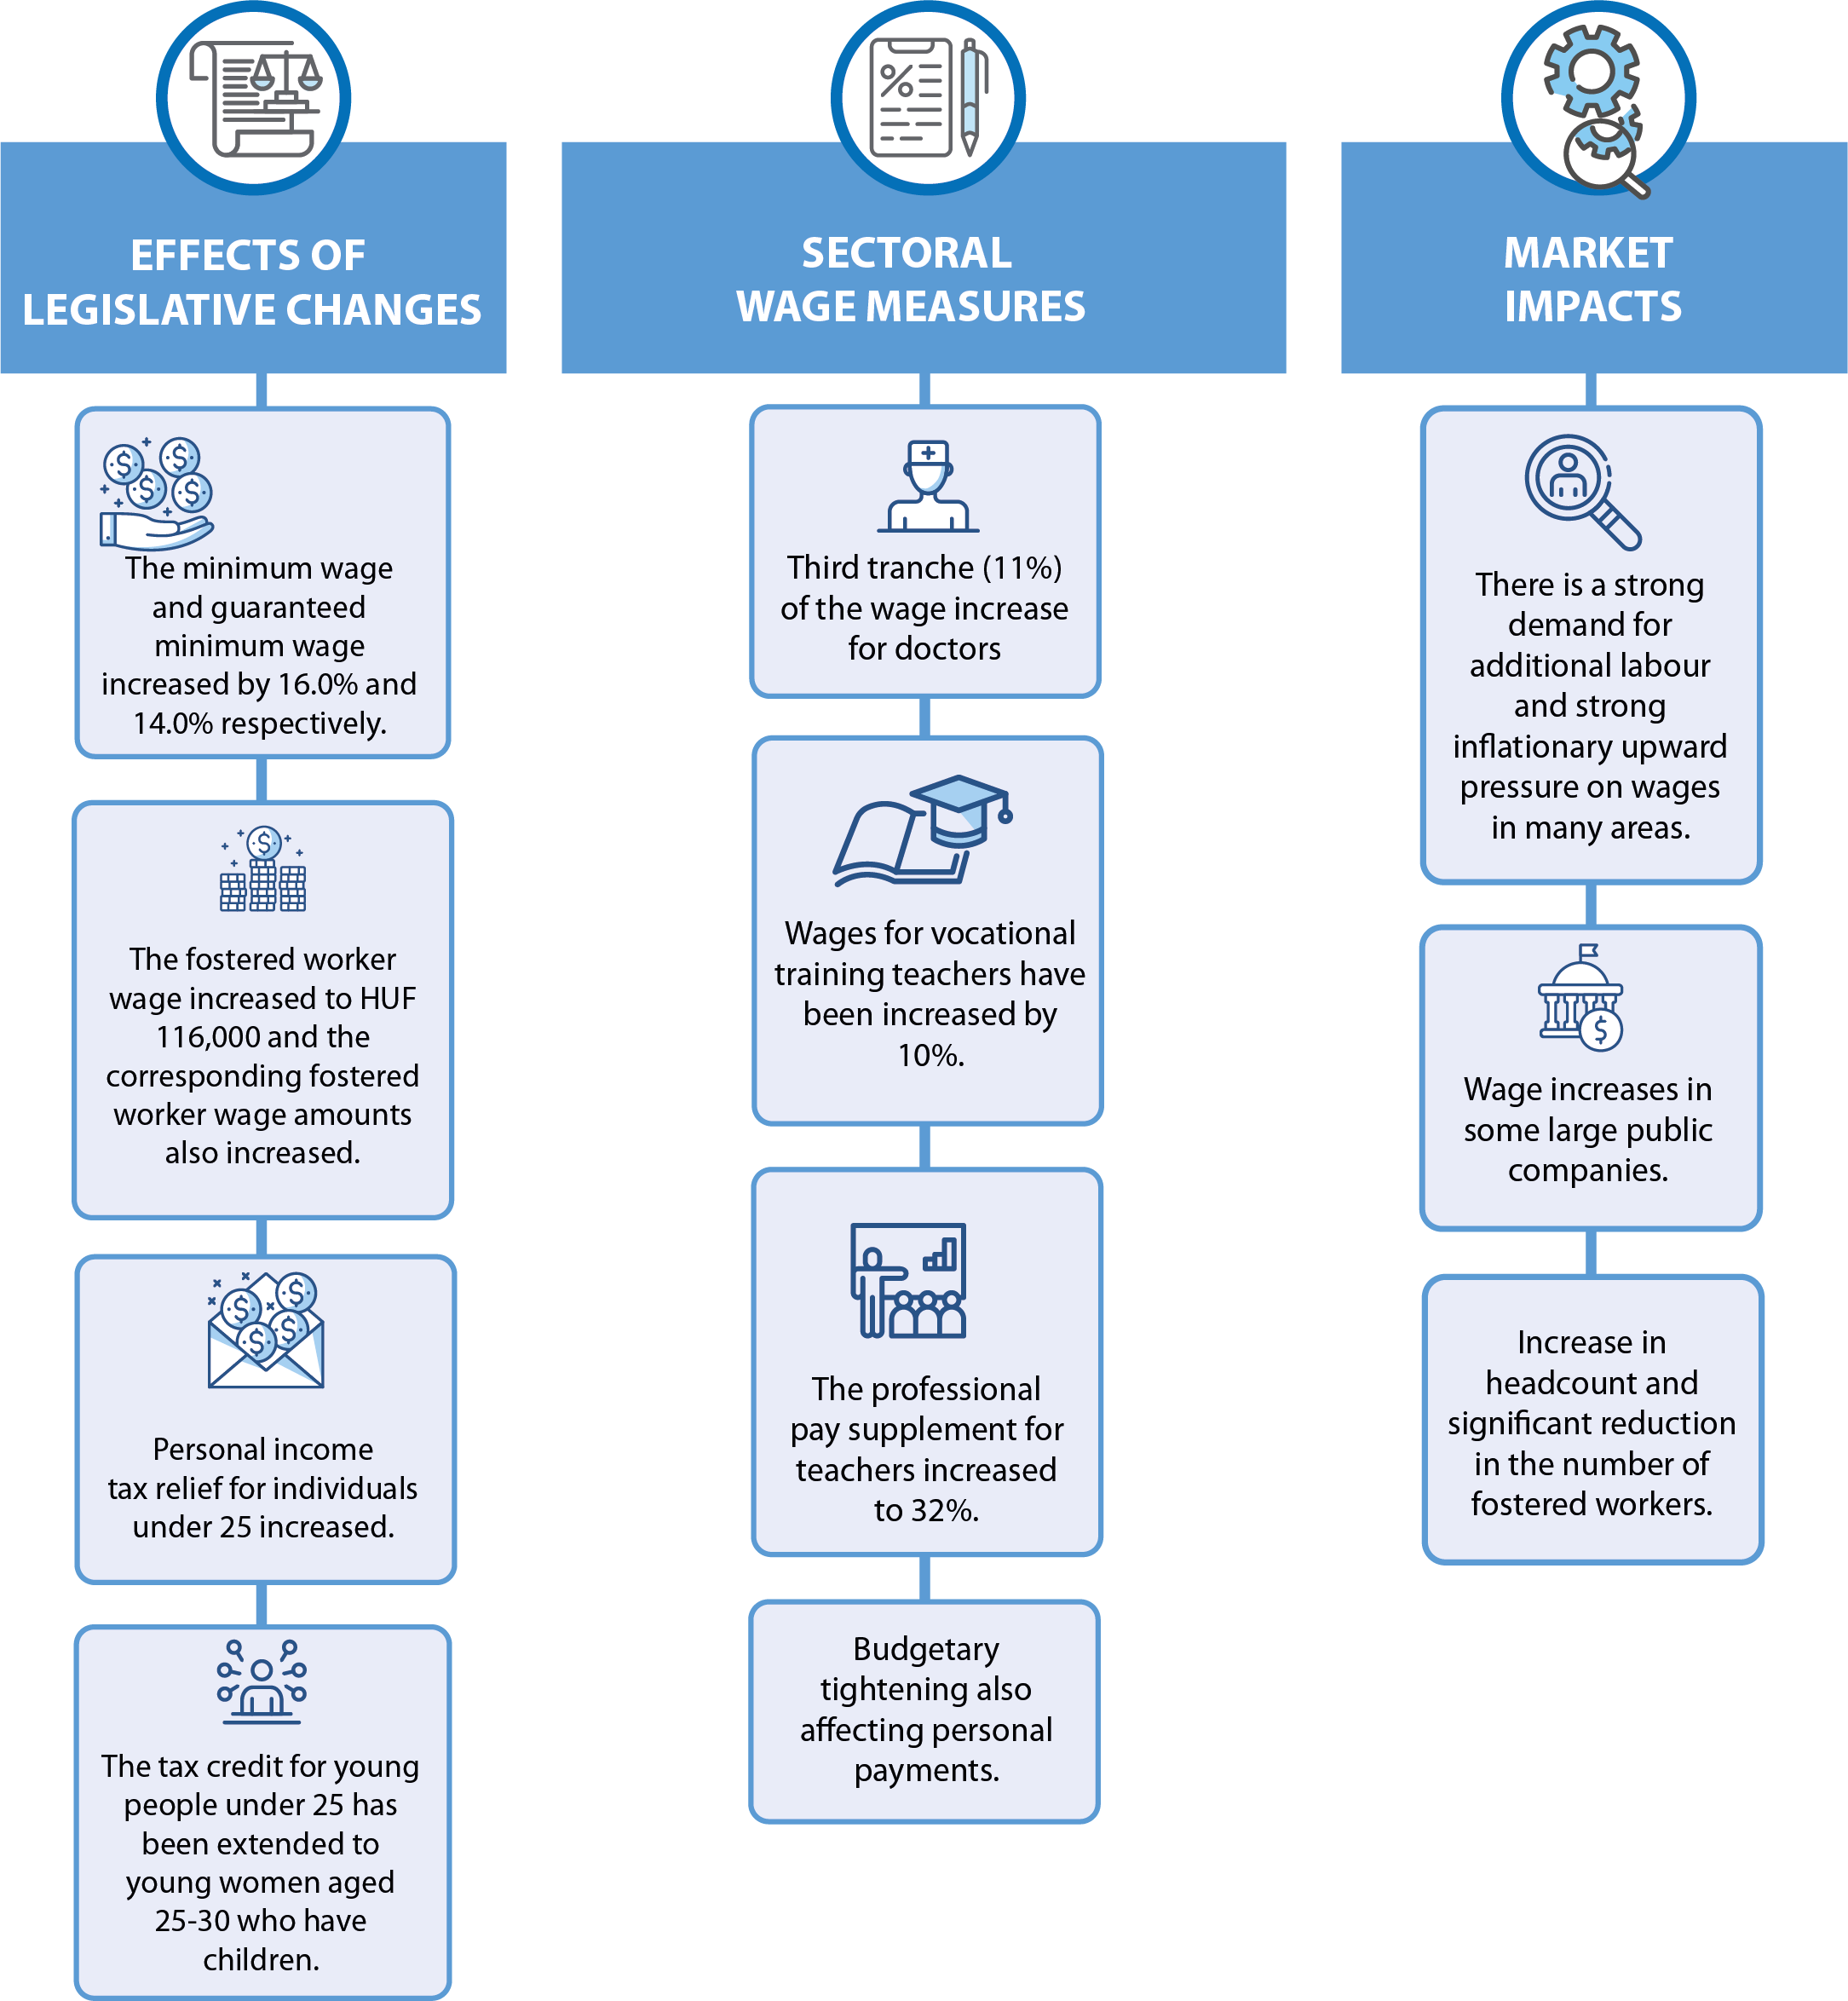
The increase in employment was mainly due to an 18 thousand increase in the number of people employed in the primary labour market, but the number of people working abroad also increased by 14 thousand. The number of people in subsidised employment as fostered workers, on the other hand, fell by 10 thousand over a year to 68 thousand.
The employment rate of 15-64 year-olds averaged 74.3% in Q1 2023, 0.4 percentage points higher than in the same period of the previous year.
In Q1 2023, the rate for women increased more than that for men, rising to 70.0% for women and 78.7% for men.
The employment rate improved the most for the 55-64 age group, rising by 2.9 percentage points in one year to 67.5%. This growth that has been going on for years is primarily related to the continuous increase in the retirement age. The employment rate for 25-54 year-olds remained high at 87.5%, after a slight decrease in Q1. Despite an increase of 0.6 percentage points over the period, the young age group continued to be characterised by a low employment rate of 28.0%.
Atypical forms of employment
Some atypical forms of employment reflect the flexibility of employment and work, while others reflect the vulnerability of workers or unfavourable working conditions. In Q1 2023, nearly 9% of the employed worked regularly or occasionally from home. The share of part-time employment in Hungary is very low by EU standards. Women were more likely to work part-time, with nearly 7% of women compared to 3% of men. By contrast, men were more likely to work non-standard hours, such as evenings/nights or weekends, and were more likely to work multiple shifts or alternating shifts.
Jász-Nagykun-Szolnok county saw the highest increase in the employment rate
In the first quarter of 2023, the employment rate of 15-64 year-olds increased the most in Jász-Nagykun-Szolnok county, by more than 4 percentage points, as in the same quarter last year. The growth was also around 2 percentage points in Nógrád, Borsod-Abaúj-Zemplén and Hajdú-Bihar counties, which have a less favourable labour market situation. Several counties were affected by the decline in employment, with Vas and Tolna counties being the most affected. The employment rate was highest in Győr-Moson-Sopron (79.9%), ahead of Budapest, and lowest in Somogy (68.0%).
Market services saw the largest increase in the number of employees
EmploymentAn employee shall be considered to be employed if he/she has an employment relationship with the employer and is/may be obliged to perform at least 60 hours of work on average per month for a fee under his/her employment contract or employment agreement. The average number of employees includes all employees, excluding persons permanently absent from work for specified reasons (e.g. maternity leave, persons not working for various childcare reasons, and from 1999 onwards, persons on sick leave for more than one calendar month, persons on unpaid leave, etc.).[1] in public administration, agriculture, mining and quarrying, water and waste management stagnated or fell, while the other branches increased. In some branches, the tightening conditions for the itemized tax of small taxpayer enterprises (kata) also contributed to the increase in the number of employees, as some of the kata-paying self-employed continued to work as employees from September last year.
Scientific and technical activities, accommodation and food service activities, and information and communication activities grew by more than 5% in staff compared to the same period last year, with increases of 13,700, 7,400 and 7,300 persons respectively. Within scientific and technical activities, accounting, book-keeping and auditing activities and tax consultancy increased the most in staff, within information and communication activities this was true for computer programming, while in accommodation and food service activities, the recovery after the Covid19 epidemic pushed employment up to above pre-epidemic levels.
Over 3% staff growth was recorded in administrative, financial and real estate services among market services and in education and health care among public services.
Although there was also a significant increase in manufacturing (6,300 people), it was well below the previous year's increase. Most sectors saw an increase in the number of employees, but there were smaller decreases in food, textiles and leather, and wood, paper and printing (around 1,300 in total), and larger decreases in transport equipment (1,600).
Unemployment has increased
In the first quarter of 2023, the average number of the unemployed was 199 thousand, and the unemployment rate was 4.1% among 15-74 year-olds. The number of the unemployed increased by 18 thousand and the unemployment rate by 0.3 percentage points compared to the same period in 2022.
The rise in the unemployment rate affected women slightly more, with a rate of 4.1% for both sexes.
The unemployment rate for 15-24 year-olds was essentially unchanged at 10.3%. Among the older age groups, the rate for 25-54 year-olds rose by 0.4 percentage points to 3.7%, while the rate for 55-74 year-olds increased by 0.2 percentage points to 3.2%.
In Q1 2023, the share of long-term jobseekers (at least one year) fell slightly to 33%, and nearly 40% of the unemployed - almost 80 thousand people - started looking for work within 3 months.
Unemployment increased in the majority of counties
In the first quarter of 2023, unemployment rose or remained little changed in most of the counties compared to the same period of the previous year. The largest increase was in Bács-Kiskun county, where the rate rose by 2.0 percentage points. However, the traditionally high unemployment rate in Szabolcs-Szatmár-Bereg county fell by 1.5 percentage points, coupled with an improvement in employment. The highest unemployment rates remained in Nógrád and Szabolcs-Szatmár-Bereg counties, at 8% or above.
The potential labour reserve has not changed
The unemployed, the underemployed and the inactive who intend to work but are not actively looking for work or do not meet the availability criteria together constitute the so-called potential labour reserve. In the first quarter of 2023, they included on average 299 thousand people, the same as a year earlier. The unemployed who are active in the labour market represent an increasing share of the reserve, while the share of inactive people is decreasing. Two-fifths of those in the potential labour reserve live in the Northern Great Plain and Northern Hungary regions, one-third have at most a primary education and another third have a vocational qualification without a school leaving certificate. The majority of those who had some work experience were in manual work, typically in manufacturing and construction or as fostered workers.
Despite the fact that the labour market has seen more labour reserve for fewer vacancies in recent quarters, the supply side is currently unable to meet the demand side's labour needs due to structural (educational level and field, regional) mismatches.
Flows between economic activity groups within the population aged 15-74 between Q4 2022 and Q1 2023
(as a percentage of the number of persons in the given activity group in Q4 2022)
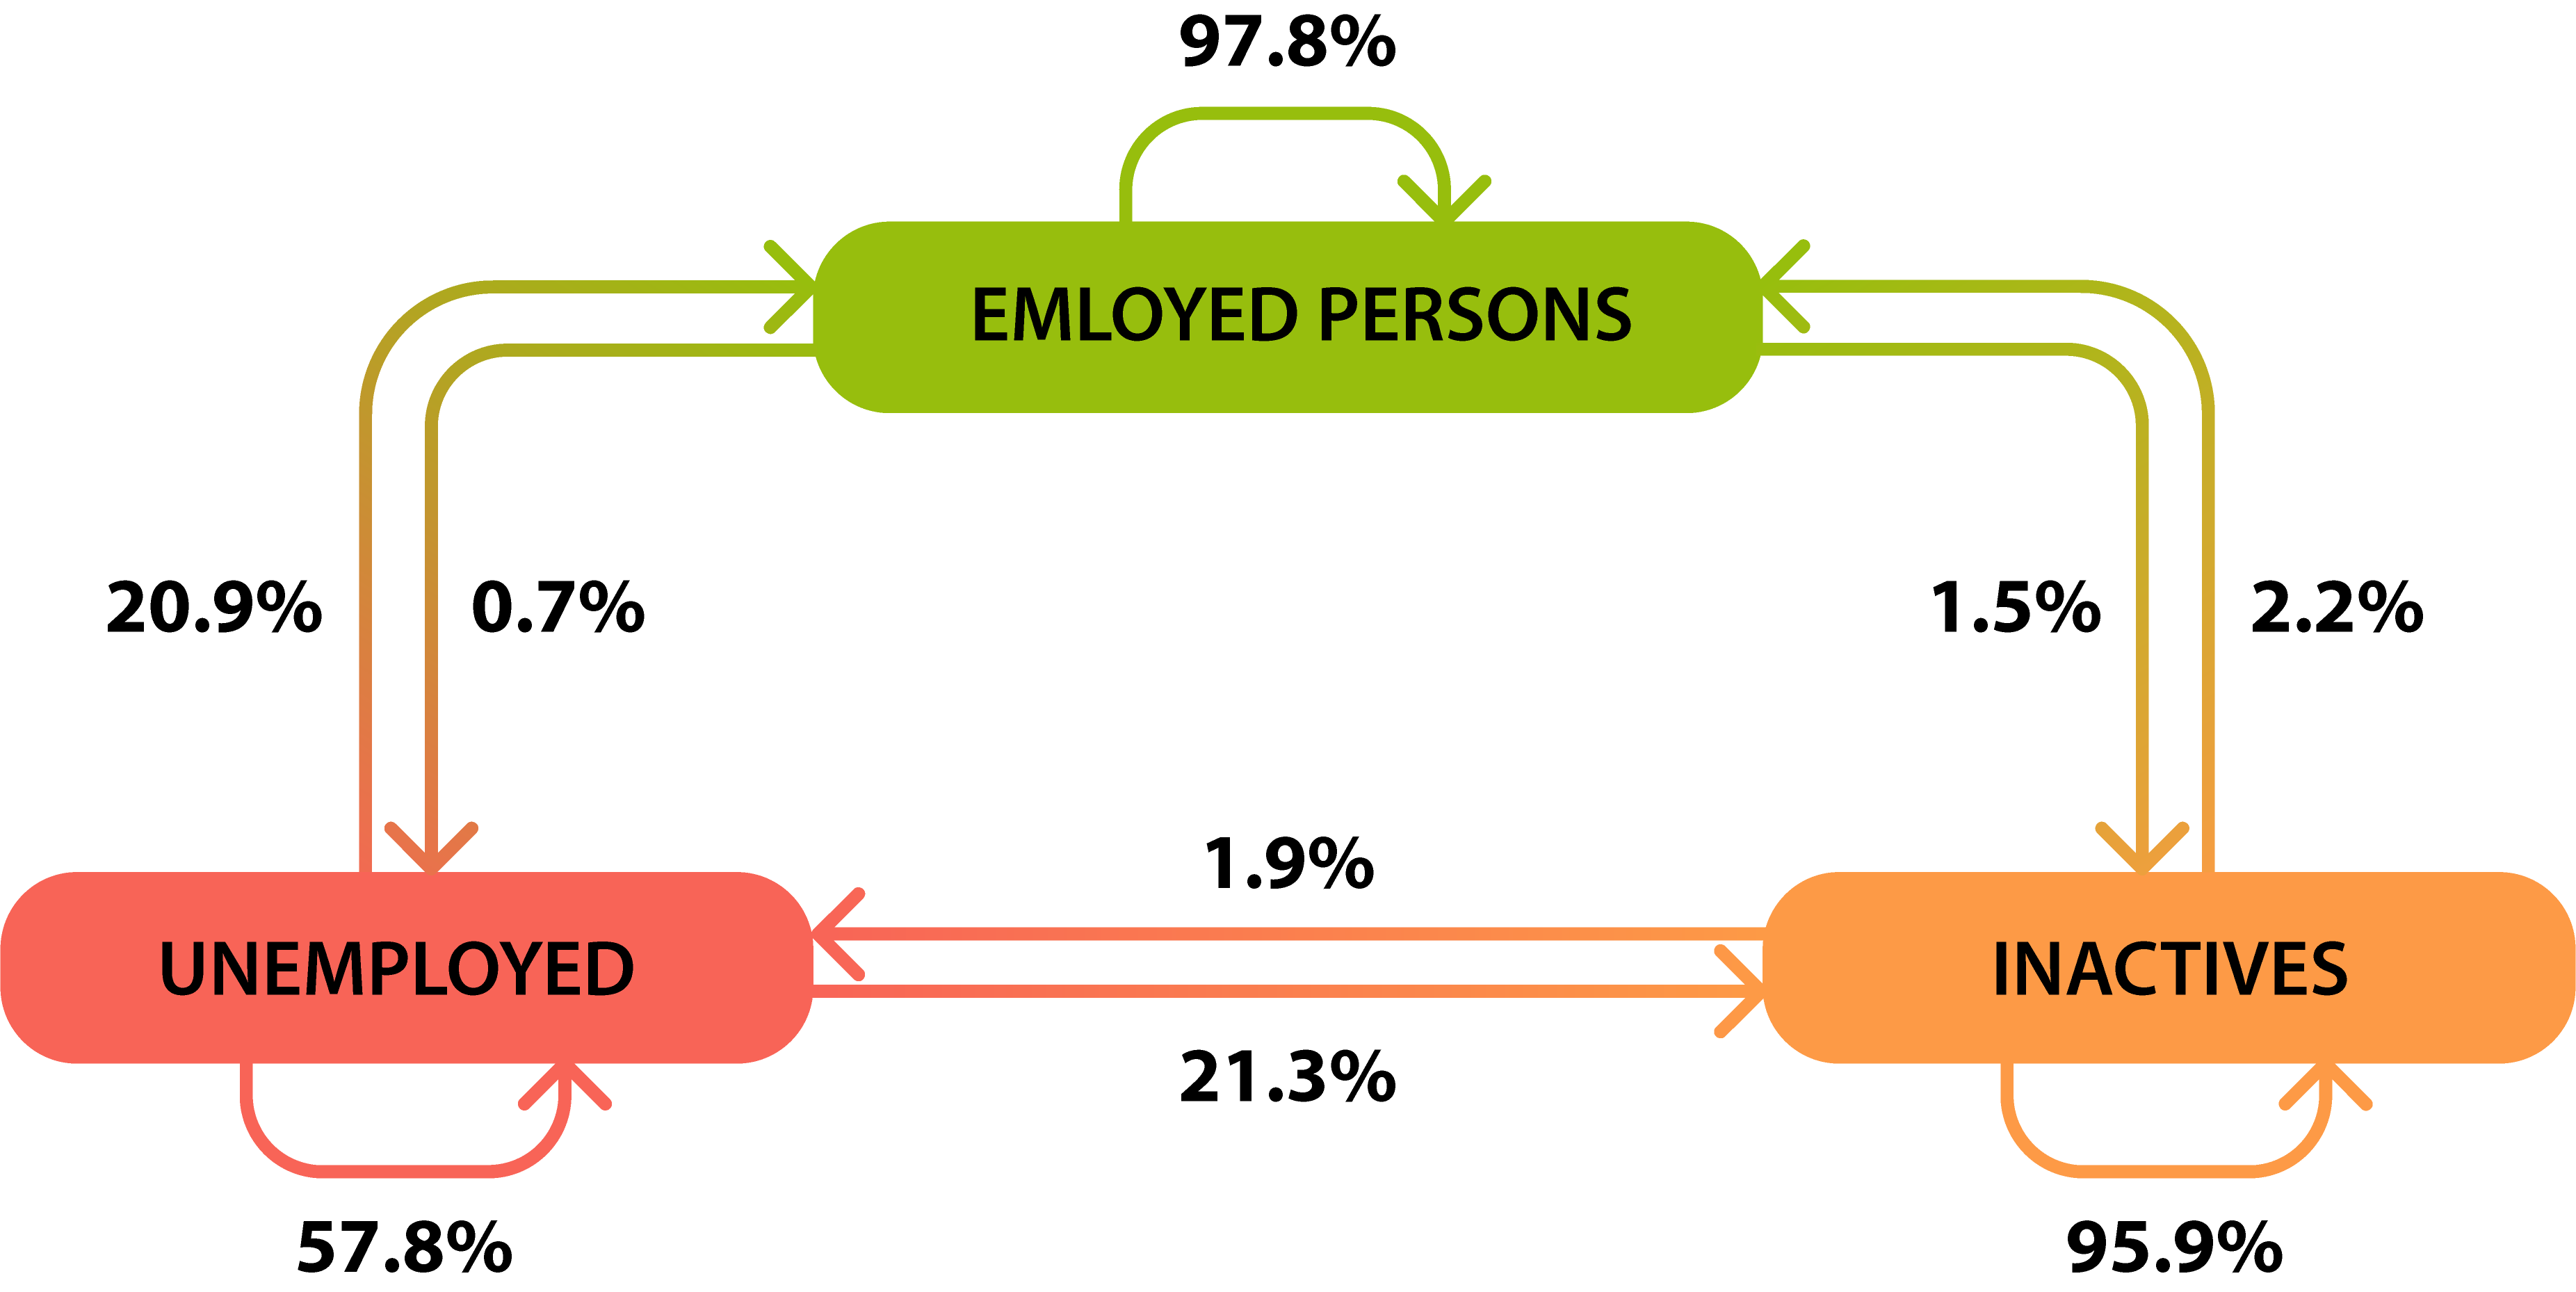
In Q1 2023, there was not much movement between activity groups either, with a slightly larger overall outflow in terms of numbers from the employed to the unemployed and inactive than from these groups to the employed.
83 thousand vacancies to be filled
The number of vacancies that are vacant or will become vacant in the near future at the end of Q1 2023 was 83 thousandBased on data from enterprises with at least five employees, budgetary institutions and non-profit organisations relevant for employment.[2], 4.3% lower than at the end of the same period a year earlier. This is the first time since 2020 that the number of vacancies has fallen compared to a year earlier. Most vacancies were in tertiary occupations, accounting for almost a quarter of all vacancies. The number of vacancies increased in managerial occupations, occupations requiring the independent use of tertiary education and agricultural occupations, while the number of vacancies decreased in the other main occupational groups.
Compared to Q1 2022, demand for additional labour fell in more than half of the sections, with the largest absolute decreases in manufacturing, wholesale and retail trade, science and engineering and public administration. One of the reasons for the decline in the demand for additional labour is the increasing employment of third-country nationals: last summer, the conditions for employment of third-country nationals were eased for several non-EU countries, resulting in a steady increase in the number of foreign workers, up 14% to 87 thousand in Q1 2023 compared to Q1 2022.
As a share of total jobs, administrative services - including temporary employment agencies - had the highest vacancy rate (5.1%), but there was also a significant shortage in health and social work (3.7%). Nationally, 2.5% of all jobs were still to be filled, 0.2 percentage points lower than in Q1 2022.
Growth in average earnings was pulled up by wage growth in the business sector
The average gross monthly earnings of full-time employeesAmong enterprises with employees, non-profit organisations and budgetary institutions.[3] reached HUF 545 700 in Q1 2023, up 10.8% in nominal terms from a year earlier. The apparent slowdown in wage growth can be attributed to the fact that in February 2022, the bonus distributed in defence and the law enforcement sector significantly increased the base value. Excluding this bonus in law enforcement and the military, the increase is estimated at 16.1%.
In 2023, the rate of scheduled wage increases was also below last year's level, and the fiscal tightening, which also affected personnel payments, restrained the growth of the budgetary sector's regular and non-regular average earnings.
Real earnings fell sharply, by 11.6% overall in Q1, reflecting more subdued wage growth at the economy-wide level and higher inflation. Excluding the impact of the bonus in law enforcement and the military, the decline in real earnings is estimated at 7.4%.
The rise in the main component of earnings, regular average gross earnings net of bonuses, premiums and 13th month pay, significantly outpaced the rise in total earnings and was 2.4 percentage points faster than a year earlier.
The other important component of earnings, non-regular earnings (bonuses, premiums, 13th month pay), declined at the economy-wide level, as the average bonus in the budgetary sector fell to one-tenth of its level due to last year's high nominal value and this year's tight fiscal management. In the business sector, although non-regular earnings increased, they increased slightly less than regular earnings.
Total, regular and non-regular* average gross earnings, Q1 2023**
| Designation | Total average gross earnings | Of which: | ||
|---|---|---|---|---|
| regular | non-regular | |||
| HUF/person/month | ||||
| Total national economy | 545,743 | 509,610 | 36,133 | |
| Of which staff groups: | ||||
| manual workers | 403,586 | 403,586 | 17,686 | |
| non-manual workers | 676,378 | 623,275 | 53,103 | |
| Of which sectors: | ||||
| business sector | 560,020 | 514,670 | 45,350 | |
| budgetary sector | 502,814 | 489,572 | 13,242 | |
| non-profit sector | 526,577 | 517,225 | 9,352 | |
| Previous year = 100.0% | ||||
| Total national economy | 110.8 | 116.8 | 64.5 | |
| Of which staff groups: | ||||
| manual workers | 110.4 | 119.0 | 42.7 | |
| non-manual workers | 110.2 | 114.7 | 75.9 | |
| Of which sectors: | ||||
| business sector | 117.8 | 118.2 | 113.4 | |
| budgetary sector | 90.4 | 113.4 | 10.7 | |
| non-profit sector | 111.8 | 112.1 | 97.0 | |
* The value of regular and non-regular earnings is based on an estimate.
** Enterprises with employees, non-profit organisations and all budgetary institutions.
Overall, including part-time workers, the full-time equivalent gross average earnings increased by 11.6% to HUF 535 269.
Wage growth was highest in industry
In the first quarter of 2023, financial services was still the highest paying branch, but information and communication was only slightly behind.
In the first quarter of the year, earnings grew fastest in industry, with manufacturing - including transport equipment, electrical machinery and machinery manufacturing - and mining and quarrying posting increases of over 20%. In market services, wage growth in administrative services, including temporary agency work, which accounts for almost a third of the branch's workforce, was strong, while in transport, storage and arts and leisure, after significant wage increases last year, wage growth was more subdued. Within public services, public administration saw a significant fall in earnings, mainly due to the impact of the bonus in law enforcement and the military on the base period. Excluding the impact of the bonus, the increase would be estimated at 10.2%. The level of growth in health care was also below average, as the wage increases and bonuses planned last year also significantly increased the base.
Median earnings were 79% of the average
In Q1 2023, median earnings rose to HUF 429 000, and increased by 16.4%, more than the average gross earnings. The median wage was not significantly affected by the February law enforcement and military bonus last year, which had a significant impact on average wage growth, and its increase was driven by, among other things, the increase in minimum wage rates and above-average wage growth for manual workers. The median was 79% of the average.
Net earnings grew slightly more than gross earnings
In the first quarter of 2023, average net earnings for full-time employees, taking into account tax benefits and exemptions from taxes and contributions, were HUF 376 100, up 10.9% over a year, 0.1 percentage point better than average gross earnings. Median net earnings after benefits reached HUF 299 300, 16.8% higher than in Q1 2022.
Earnings disparities remain high
Earnings differentials remained high in Q1 2023, with the average salary of those at the top of the wage hierarchy almost five times that of those at the bottom. The difference in earnings is influenced by a number of factors: the most important are the occupation of the employee, the level of education and skills required, the sector of employment, the size of the employer and its ability to pay wages.
The rate of average wages for those in the extreme two quintilesEarnings quintiles are obtained by ranking employees according to the size of their earnings and then dividing them into five equal population groups.[4] has fallen slightly compared to the previous year, as wages for those in the top quintile increased at a slower pace than those in the bottom quintile in Q1 2023.
Regional differentiation of earnings continued to be significant, with the average salary in the capital city more than 70% higher than in the last-ranked Szabolcs-Szatmár-Bereg county, 11% higher than in the second-ranked Győr-Moson-Sopron county and 22% higher than the national average. Regional differences are significantly influenced by the different employment structure, the composition of the employed by sector and occupation, and the different weight of public work schemes and their changes.
Earnings increased significantly in all counties, with Győr-Moson-Sopron county showing an outstanding increase of more than 20%. High wage growth was also recorded in Komárom-Esztergom and Pest counties, which also have a significant share of people employed in industry. Lower growth - below 10% - was also recorded in the counties of Csongrád-Csanád, Nógrád, Szabolcs-Szatmár-Bereg and Tolna, which have a smaller industrial base and/or a higher share of budgetary workers, and in Budapest, which has a high nominal average wage.
Hungary's employment rate remains above the EU average
In the EU, the Netherlands had the highest employment rate (82.1%) and Greece the lowest (60.3%) in Q1 2023. Hungary ranked in the top third of Member States with 74.3%, 4.4 percentage points above the EU average. Among the V4 countries, the Czech Republic had the highest employment rate (75.6%) and Slovakia the lowest (71.3%), but all four countries were above the EU average (69.9%).
The employment rate for men was highest in the Netherlands (85.7%) and lowest in Croatia (67.7%). The 78.7% rate for men in Hungary was 4.1 percentage points above the EU average, making it the sixth highest rate in the EU.
Like for men, the employment rate for women was highest in the Netherlands (78.5%) and lowest in Greece (50.8%). At 70.0%, the rate for Hungarian women was in the top third in the EU, 4.8 percentage points above the EU average.
In the EU, the Czech Republic had the lowest unemployment rate (2.6%) and Spain the highest (13.3%) in Q1 2023. Hungary's unemployment rate of 4.1% was ranked seventh to eighth in the EU, together with Ireland, and 2.2 percentage points lower than the EU average (6.3%). For both sexes, Hungary's unemployment rate was lower than the EU average.
Hungary's demand for additional labour is just below the EU average
In the first quarter of 2023, there were 2.8 vacancies for every 100 jobs in the European Union.Scope: industry, construction, services (excluding activities of households and non-residential organisations).[5] Austria, Belgium and the Netherlands had the highest additional labour demand, while Bulgaria, Spain, Poland and Romania had the lowest. In Hungary, the vacancy rate of 2.6% was higher than in half of the EU Member States, including neighbouring Romania, Slovakia and Croatia.
[1]:↑ An employee shall be considered to be employed if he/she has an employment relationship with the employer and is/may be obliged to perform at least 60 hours of work on average per month for a fee under his/her employment contract or employment agreement. The average number of employees includes all employees, excluding persons permanently absent from work for specified reasons (e.g. maternity leave, persons not working for various childcare reasons, and from 1999 onwards, persons on sick leave for more than one calendar month, persons on unpaid leave, etc.).
[2]:↑ Based on data from enterprises with at least five employees, budgetary institutions and non-profit organisations relevant for employment.
[3]:↑ Among enterprises with employees, non-profit organisations and budgetary institutions.
[4]:↑ Earnings quintiles are obtained by ranking employees according to the size of their earnings and then dividing them into five equal population groups.
[5]:↑ Scope: industry, construction, services (excluding activities of households and non-residential organisations).
Further data and information
Contact details:
kommunikacio@ksh.hu
Contact us
Telephone: +36 (1) 345 6789
www.ksh.hu