
Key figures
Inflation
Indicator description
Average change in the prices of goods and services purchased by households for own use, compared to the same period of the previous year. The consumer price index less 100 equals the inflation rate.
Source:
Summary tables (STADAT)
Latest data: –
GDP
Indicator description
Gross domestic product is the sum of gross value added produced by industries or sectors, valued at basic prices, and of the balance of taxes and subsidies on products, which cannot be divided by industry or sector, less financial intermediation services not divided by industry or sector. GDP volume change compared to the same period of the previous year is presented based on unadjusted data.
Source:
Summary tables (STADAT)
Latest data: –
Adjusted population
Indicator description
The full-scope censuses conducted every ten years show a comprehensive picture of the number and composition of the population. For determining the annual population number in the period between two censuses, the starting point is the population number of the last census (currently the census with the reference date of 1 October 2022), and from this, the population was estimated by using natural increase or decrease data available from the statistics of vital events until 2000. From 2001 international migration is also taken into account.
Source:
Summary tables (STADAT)
Latest data: –
Unemployment rate
Indicator description
The ratio of unemployed persons to the economically active population of corresponding age. The indicator can be calculated for different age groups, the default is the age group 15–74. Further selected age groups: 15–24, 25–54, 55–74.
Source:
Summary tables (STADAT)
Latest data: –
Employment rate
Indicator description
The ratio of employed persons to the population of corresponding age. The indicator can be calculated for different age groups, the default is the age group 15–64. Further selected age groups: 15–24, 25–54, 55–64 and 20–64.
Source:
Summary tables (STADAT)
Latest data: –
Industrial production
Indicator description
We measure changes of industrial production by variations of industrial production values, however the impact of price change is filtered out. We calculate the volume index of production based on comparative prices data of the industrial production value (presented at reference period price levels).
Source:
Summary tables (STADAT)
Latest data: –
Featured
HCSO Monitor
The collection of interactive figures provides up-to-date information on the latest domestic and international socio-economic trends.
The decisive part of the figures included in HCSO Monitor are downloadable in both image and data formats (PNG, SVG and CSV).
Feel free to browse the data in HCSO Monitor, updated many times a week!
Latest update: 28/05/2026
The decisive part of the figures included in HCSO Monitor are downloadable in both image and data formats (PNG, SVG and CSV).
Feel free to browse the data in HCSO Monitor, updated many times a week!
Latest update: 28/05/2026

Snapshots, 2025 – Social protection
In 2025, nearly 73 thousand children were registered as being at risk in Hungary, of whom guardianship authorities placed almost 34 thousand minors under protection. The child protection specialist care system has undergone significant changes in recent years: the emphasis has shifted from institutional care to foster placement, and the role of religious organisations has increased considerably. Approximately 360 thousand persons used basic social services. Residential institutions providing long-term and temporary placement cared for more than 87 thousand beneficiaries.
02/06/2026
02/06/2026

UEFA Champions League final – Budapest, 2026
The tournament of European elite men’s clubs (formerly named European Champion Clubs’ Cup) has been organised by UEFA, the Union of European Football Associations every year since 1955. The final of the event, named Champions League since the 1992/93 season, will be held for the first time in Hungary. The match will take place on 30 May 2026 in Budapest, in the Puskás Aréna – named after Ferenc Puskás, the legendary, three-time European Cup winner footballer –, where Arsenal and Paris Saint-Germain will fight for the trophy, and the latter as the defending champion.
29/05/2026
29/05/2026
Statistical Pocketbook of Hungary, 2025
The tables and charts in the latest edition of the Statistical Pocketbook of Hungary provide a comprehensive insight into the development of social and economic trends in Hungary during the year 2024. It aims to provide a summary picture of the country's situation in all possible areas based on preliminary indicators. In this year’s pocketbook, alongside the NACE Rev. 2 classification, we also publish the number of business units according to the new NACE Rev. 2.1 structure, as well as foreign trade data compiled under the new methodology.
27/05/2026
27/05/2026
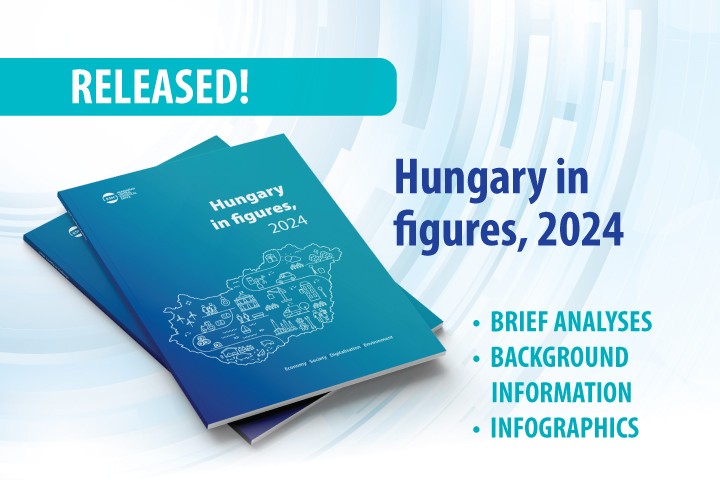
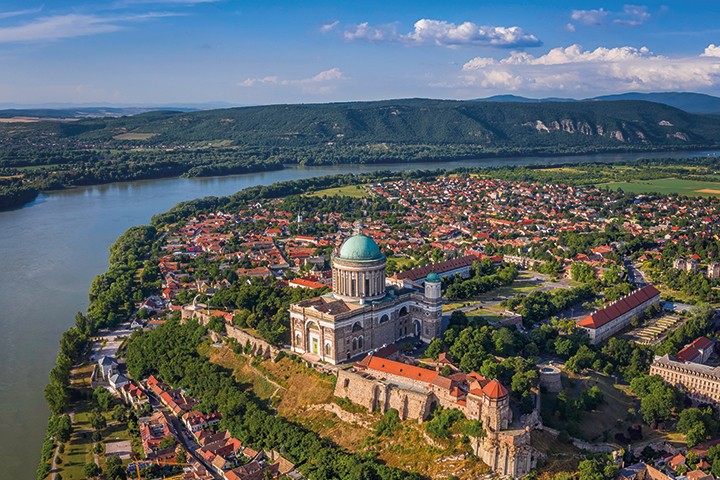
Hungary in figures, 2024
Hungary’s population on 1 January 2024 was 9 million 585 thousand people, with nearly 18% living in the capital city, almost 53% in towns, and 30% in villages. In 2023, Hungary’s trade surplus in goods reached its highest level since 2016 (9.0 billion euros), while the surplus in services also rose to a record high (11.0 billion euros). Both the production volume and average yield of the major arable crops increased; the production of barley reached an unprecedented level of 2.2 million tonnes.
27/05/2026
27/05/2026

Snapshots, 2025 – Pensions and other benefits
At the beginning of 2026, 2,421 thousand people in Hungary received a pension or other pension benefits, and 77% of the people entitled received an old-age pension over retirement age. Those receiving a pension or other benefits received an average of 240 thousand forints as full benefits. The average amount of old-age pension equalled 261 thousand forints, with men’s benefits 44 thousand forints higher than women’s, due to the typically longer service time and higher earnings.
22/05/2026
22/05/2026

Snapshots, 2025 – Retail trade
The calendar adjusted volume of domestic retail sales in 2025 exceeded the previous year’s level by 2.9%. Sales volumes rose by 2.5% in specialized and non-specialized food shops, by 4.1% in non food retailing, and by 1.0% in automotive fuel retailing. By the end of June 2025, the number of retail outlets was 2.6% lower – around 2,500 fewer – than a year earlier, while the average floorspace of shops increased by 3.9% over the same period.
22/05/2026
22/05/2026
Day of Szeged
The free royal city of Szeged received its charter from King Charles III on 21 May 1719: this date has been celebrated as the city’s official day since 1990. In 1962, it became the seat of the then Csongrád County. Today it is the second most populous city outside Budapest. It is a cultural, educational, and economic centre. Its theatre, the Szeged Open-Air Festival, and its higher education institutions all have a long and distinguished history. In recent decades, its economy has shifted from the food industry—paprika, Pick salami, and its canning factory—toward vehicle manufacturing.21/05/2026

Quarterly non-financial sector accounts, 4th quarter 2025
According to seasonally and calendar adjusted data, financial corporations as well as households and non-profit institutions serving households (NPISHs) were in a net lending, while non-financial corporations and general government in a net borrowing position in the 4th quarter of 2025. The gross saving rate of households and NPISHs came to 16% and their gross investment rate to 5.5%. The gross profit share of non-financial corporations reached 38% and their gross investment rate 30%.
21/05/2026
21/05/2026
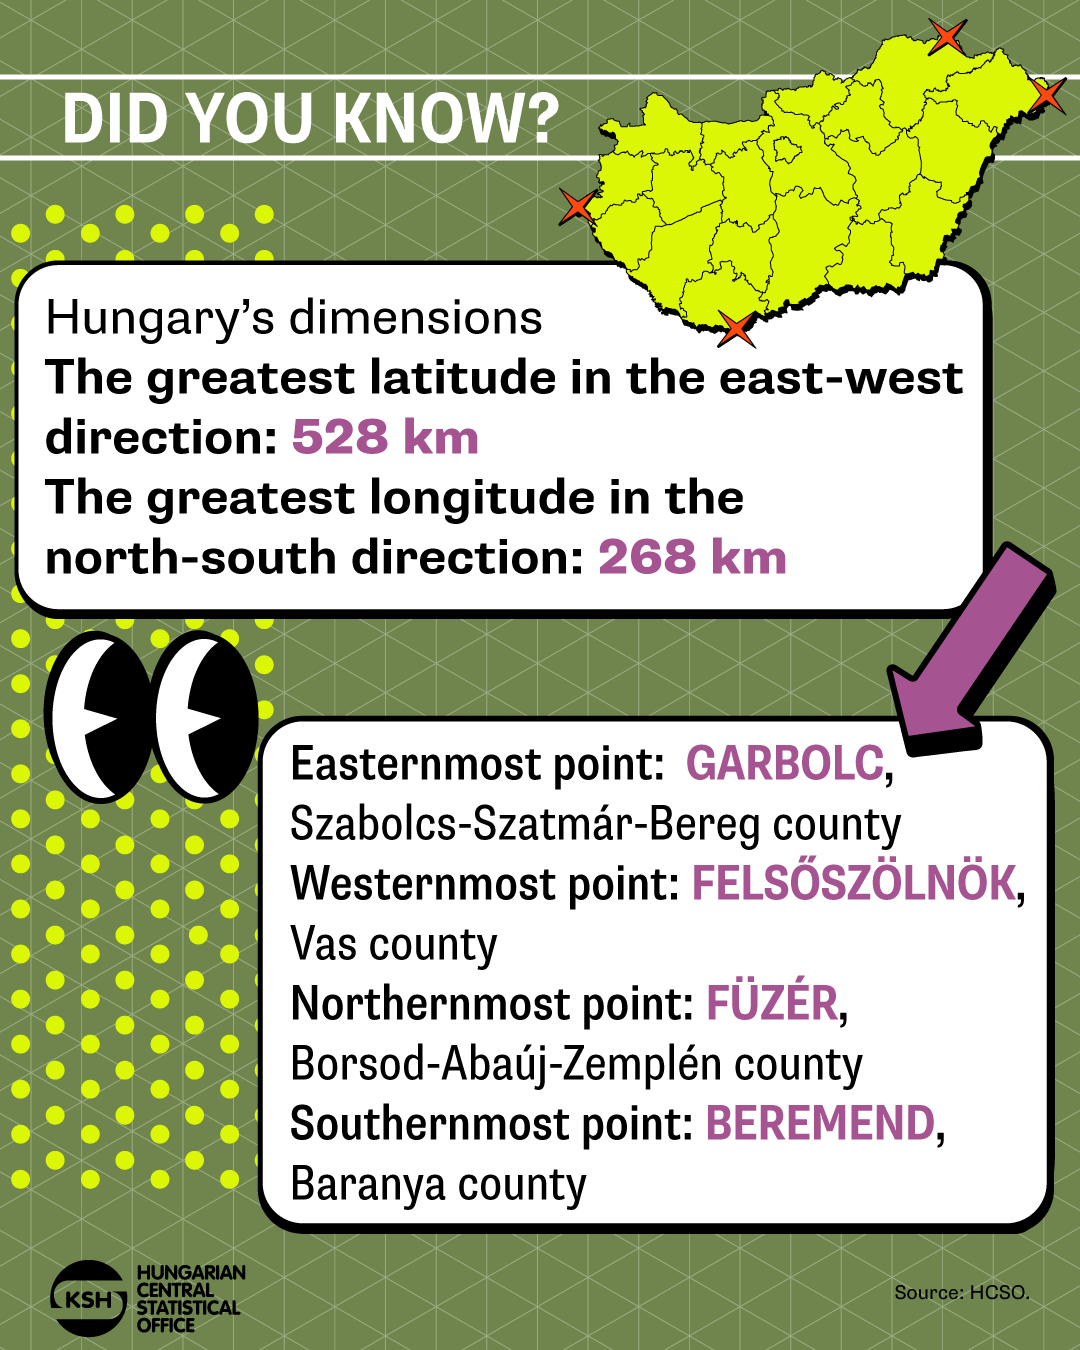
Did you know? – Hungary’s dimensions
The greatest latitude in the east-west direction: 528 km
The greatest longitude in the north-south direction: 268 km
If you liked it, check out our data visualisations at this link: www.ksh.hu/datavisualisations
21/05/2026
The greatest longitude in the north-south direction: 268 km
If you liked it, check out our data visualisations at this link: www.ksh.hu/datavisualisations
21/05/2026
First releases
News, events
- HCSO and the University of Debrecen Strengthen Cooperation in Education and Research & Development, 03/06/2026
- Where Do Hungary’s Highest Earners Live? The Answer May Surprise You…, 01/06/2026
- Numbers, creativity and vision: author’s competition for young people, 19/05/2026
- The estimation of quarterly external trade in services data with monthly figures for February 2026 has been published, 08/05/2026
- HCSO publishes April motor fuel price statistics, 08/05/2026
