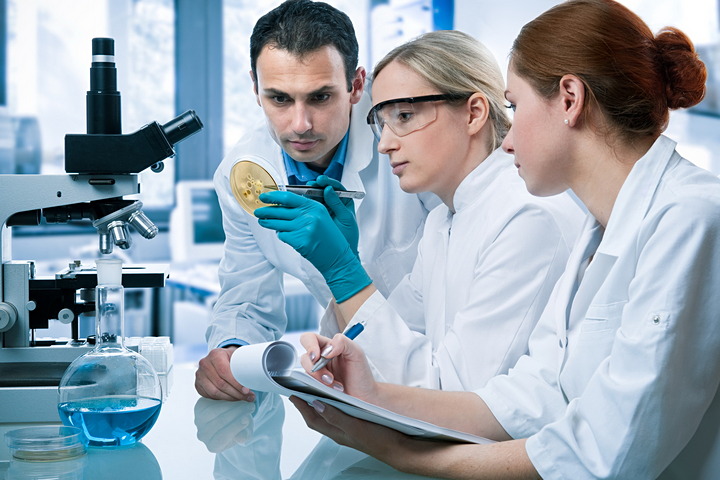
Science and technology
To increase the stock of scientific knowledge on man, society, environment and technology is an important tool to improve the quality of life and competitiveness. These activities are covered by R&D statistics, providing information among others on the number of research and development units, employment in R&D activities, the amount and sources of expenditure as well as the results of research and development. We collect data on the innovation activities of enterprises – relying on the results of R&D in many cases – every two years, in the frame of the innovation survey of the Community, harmonised at EU level.
Key figures
R&D expenditure as a percentage of GDP
Indicator description
Amount of R&D expenditure (R&D current costs and R&D capital expenditure) as a proportion of gross domestic product (GDP) in a particular year.
Source of data:
Summary Tables (STADAT)
Last data for period: 2024
Number of staff performing R&D activities, as a percentage of total employment
Indicator description
Internal R&D staff in full-time equivalents as a proportion of total employment.
Source of data:
Summary Tables (STADAT)
Last data for period: 2024
R&D capital expenditure as a percentage of investments in the national economy
Indicator description
R&D capital expenditure as a proportion of total economic investments in current year. R&D capital expenditure is the value (excluding VAT) of purchases in the current year of tangible assets and computer software used directly in research and development activities.
Source of data:
Summary Tables (STADAT)
Last data for period: 2024
Proportion of innovation-active enterprises
Indicator description
Enterprises which engaged at some time during the observed period in one or more innovation activities to develop or implement new or improved products or business processes for an intended use, as a proportion of all enterprises employing at least 10 people. Innovation activities include all developmental, financial and commercial activities undertaken by an enterprise that are intended for or result in an innovation for the enterprise.
Source of data:
Summary Tables (STADAT)
Last data for period: 2022–2024
Featured
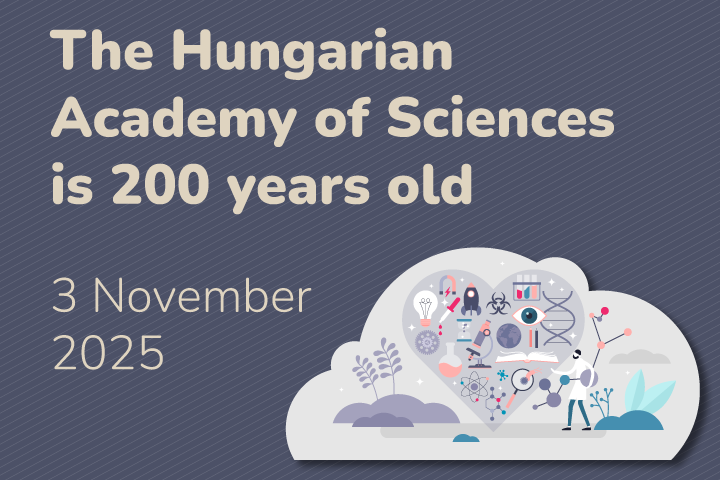
The Hungarian Academy of Sciences is 200 years old, 3 November 2025
On 3 November, 2025, we celebrate the 200th anniversary of the Hungarian Academy of Sciences. On 3 November, 1825, at the National Assembly in Pozsony (today Bratislava), István Széchenyi, by the inspiring speech of Pál Felsőbüki Nagy, offered the annual income from all his estates to establish a Learned Society, which has been called the Hungarian Academy of Sciences since 1858. In 2024, the institution had a total of 687 national and foreign members (including 63 women), nearly 30% of whom worked in research and development institution in Hungary.
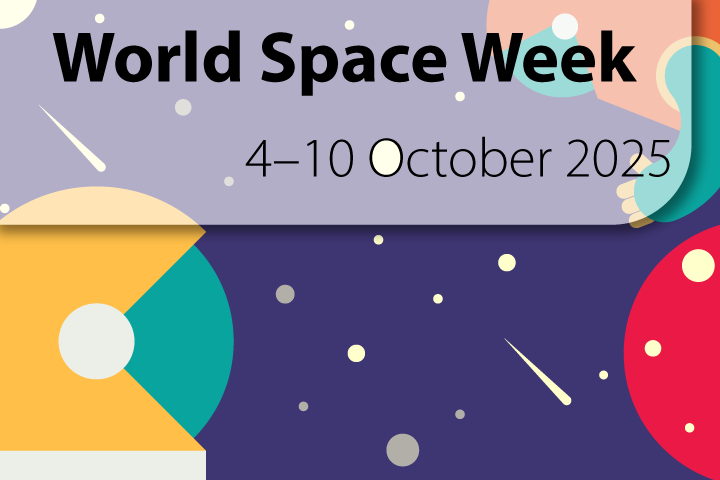
World Space Week, 4–10 October 2025
World Space Week is held between 4 and 10 October each year, since the two dates refer to significant ones each in space research: Sputnik 1, the first man-made satellite was launched on 4 October 1957, and the treaty laying down that space research can be used only for peaceful purposes entered into effect on 10 October 1967. Hungary’s space history, thanks to Tibor Kapu’s mission, is written even today.
Statistical Yearbook of Hungary, 2024
The yearbook provides an overview of Hungary's demographic, social and economic trends, environmental characteristics and their changes over time, with the help of tens of thousands of data in some 500 tables, charts and maps. In the chapter devoted to earnings and incomes, it is a novelty compared to previous years that net earnings in which allowances and types of exemptions are accounted for, too, came into focus from 2019. In the number of employees, people working in working time shorter than 60 working hours per month are also taken into account. In addition, the theme of environment is completed with areas declared world heritage sites by UNESCO.
Snapshots, 2024 - Research and development
The sum allocated for R&D (research and development) continued to increase in 2024, according to preliminary data. Hungary spent 1075 billion HUF (1.32% of GDP) on research and development, 3.3% more on current prices than in 2023. Out of the total R&D expenditures experimental developments represented 57%, basic research 23%, about one-fifth applied research. R&D expenditures per business enterprise R&D unit went up by 20% compared to 2023.

Hungarians in space
Humanity wishes for a long time to reach the stars and space exploration gains nowadays an ever-increasing role in research and development. Hungary spent 19.4 billion HUF between 2021-2023 for this purpose, 16% more than in the 2010-2020 period. Bertalan Farkas was, 45 years ago, on 26 May 1980, the first Hungarian astronaut in the cosmos, the Hungarian nation becoming as such the seventh to reach the space. Tibor Kapu, the next Hungarian, starts his space mission on 8 June 2025.
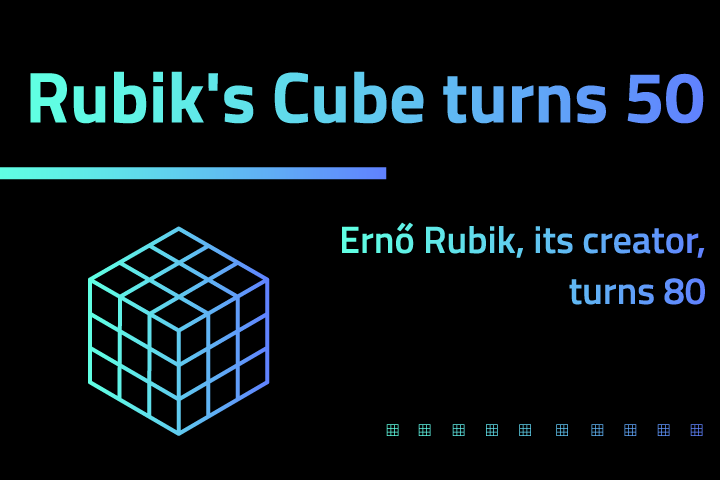
Rubik's Cube turns 50
Ernő Rubik, the creator of the Rubik's cube, will turn 80 on 13 July 2024. The story of the game began in 1974, when the architect and university professor built a magic cube out of wood and rubber to develop spatial thinking in students. At first he didn't believe in its success, finding it too difficult to put together, but by the 1980s the cube had become world famous. Its popularity has continued ever since, winning the Toy of the Year award many times around the world. More than 400 million copies of one of the most successful games of all time have been sold.
Research and development, 2017 (preliminary data)
In 2017, HUF 517 billion, 1.35% of GDP was spent on research and development activities at the level of the national economy. Nearly 74% of research and development expenditure came from the activities of business enterprises at the level of the national economy, R&D units in higher education as well as R&D institutes and other budgetary research units accounted for 13% each. The significant part of tender resources of 2016 were used in 2017, as a result of which R&D expenditure financed from the government budget rose to the highest extent, by nearly HUF 53 billion (by 47%) at current prices. R&D expenditure financed by the sources of business enterprises rose by HUF 31 billion (by 13%). Out of the financial sources of R&D expenditure only the amount of funds from non-profit organisations that decreased, by 10.5% over a year.
Related themes
- Business units and non-profit organisations
- Men and women
- National accounts, GDP
- Regional statistics
- The young and the elderly
Methodological information
Release and revision calendarPublication repertory
Data visualisations