Culture
Culture contributes to the competitiveness of the society by strengthening the foundations of a knowledge-based society, in which the development of public culture and community development also play an important role. Cultural statistics includes the measurement of areas dealing with the cultural activities of society (e.g. theatre, cinema, museum, library, mass media, book production, etc.), the communication of data on cultural spending and funding.
Key figures
Budgetary expenditure on culture as a percentage of GDP
Indicator description
These expenditures include the ones on books, music and journal publishing, radio, television broadcasting, cultural activities, artistic activities, zoological and botanical gardens, national parks, historic landmarks, as well as other entertainment and cultural activities.
Source of data:
Summary Tables (STADAT)
Last data for period: 2024
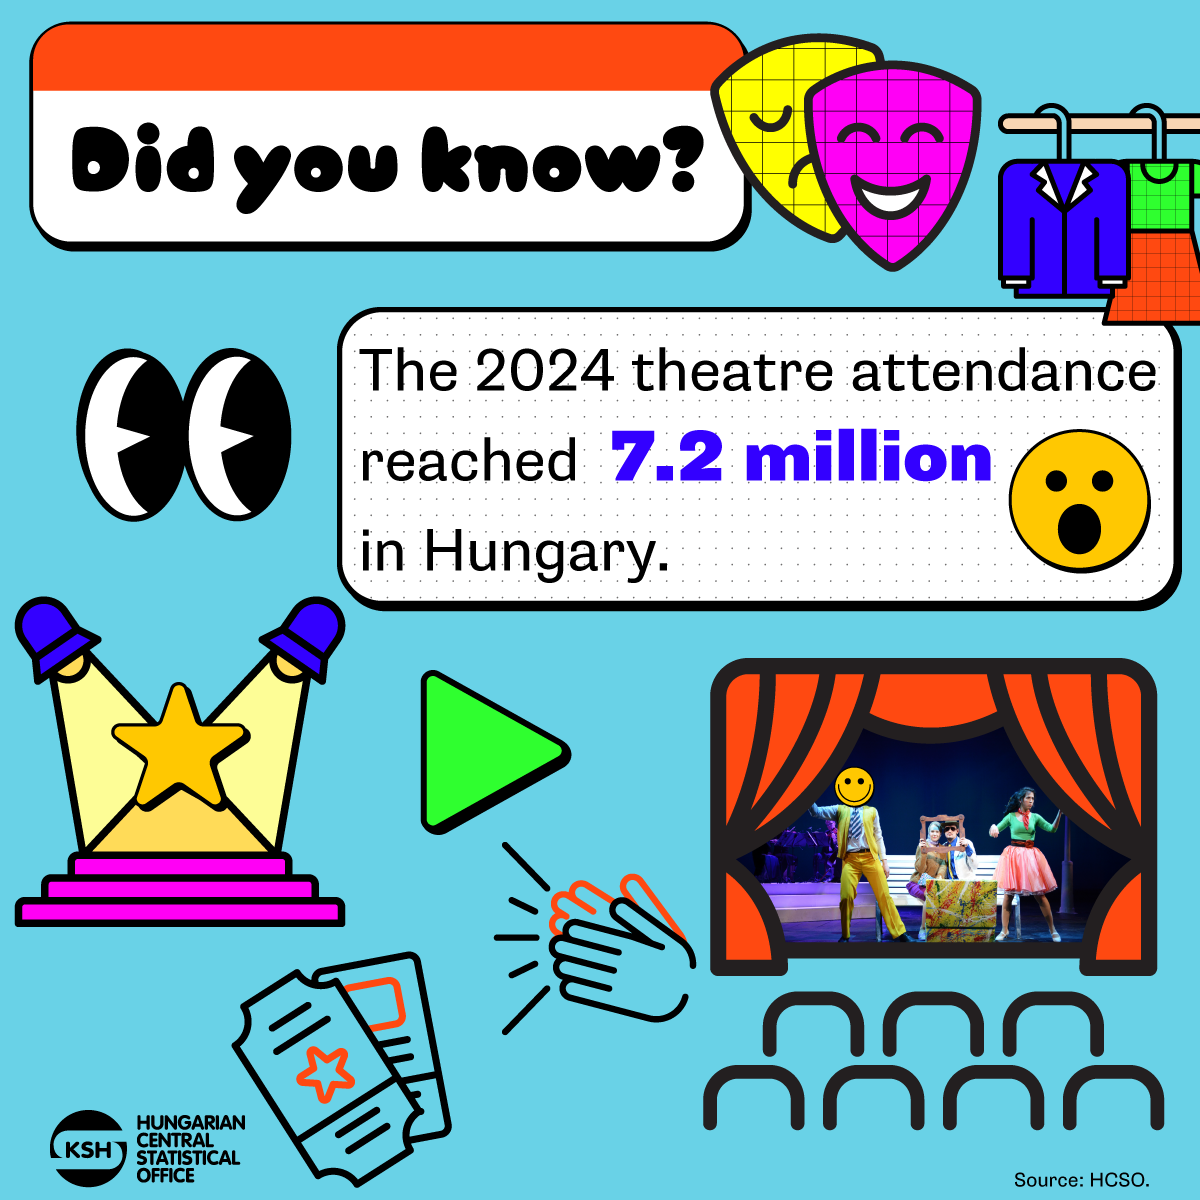
Number of theatre visits per thousand inhabitants
Indicator description
Number of theatre visits per thousand inhabitants. When determining the number of theatre visits, every visitor is taken into account as many times as many performances he/she attended. The indicator meaures the number of thetre visits per thousand inhabitants.
Source of data:
Summary Tables (STADAT)
Last data for period: 2024
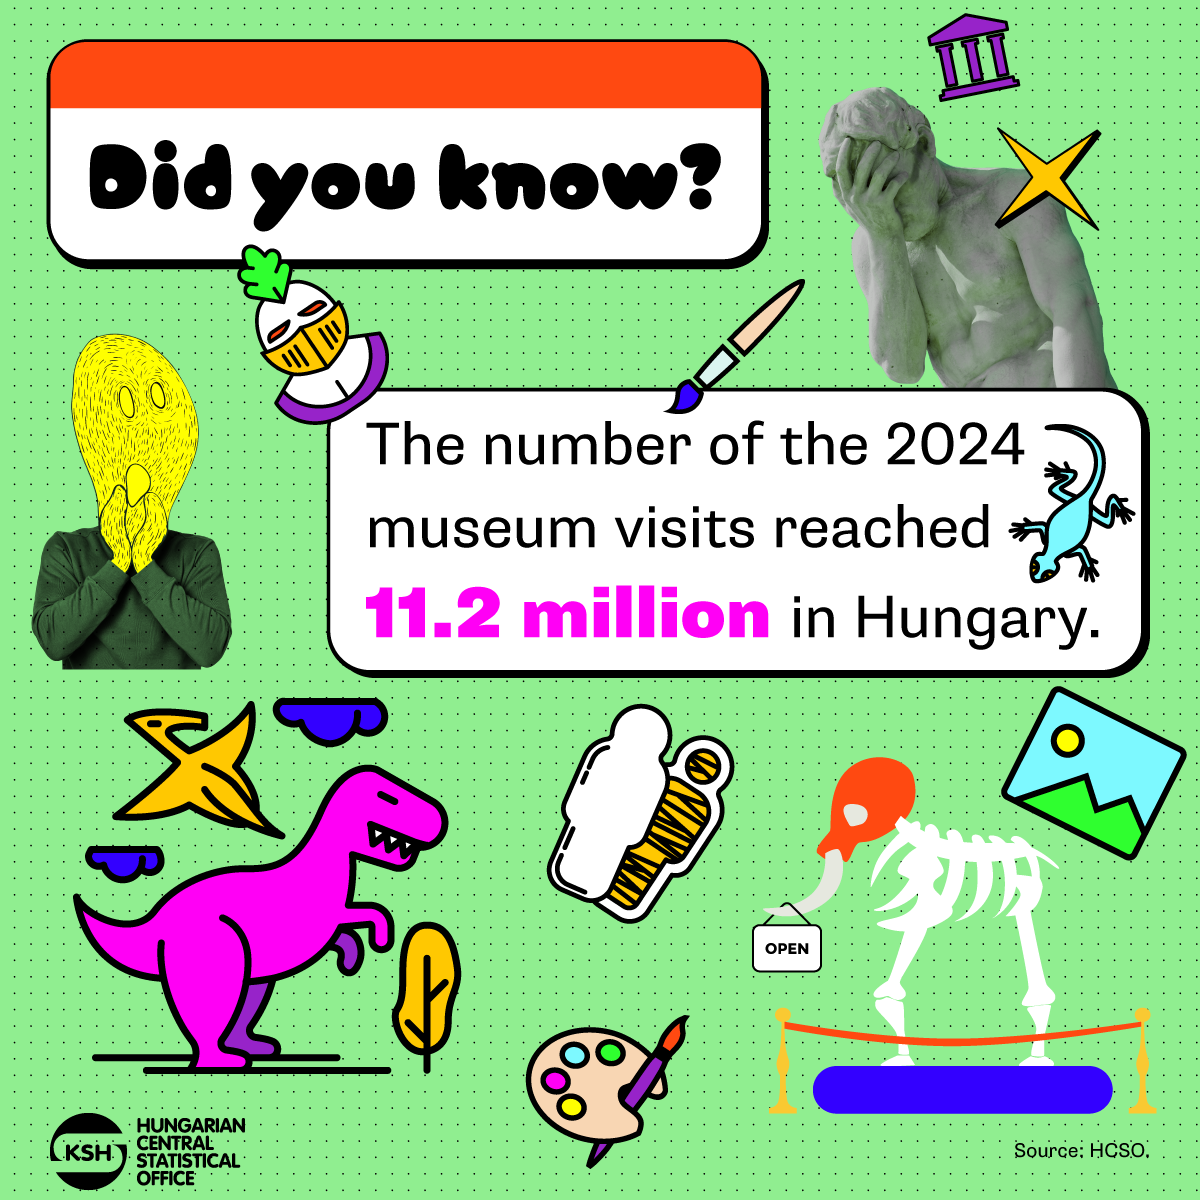
Number of museum visits per thousand inhabitants
Indicator description
When determining the number of museum visits, every visitor is taken into account as many times as many exhibitions he/she attended.
Source of data:
Summary Tables (STADAT)
Last data for period: 2024
Number of published books, booklets
Indicator description
Published book: a work prepared by printing or other means of reproduction having min. 49 pages, which is included in the National Bibliographies and made available to the public. Published booklet: a work prepared by printing or other means of reproduction having 4–48 pages, which is not published periodically and is made available to the public. Re-prints of a book are considered as separate publications.
Source of data:
Summary Tables (STADAT)
Last data for period: 2024
Featured
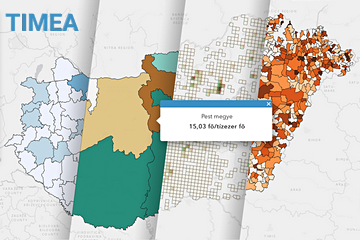
HCSO Monitor
The collection of interactive figures provides up-to-date information on the latest domestic and international socio-economic trends. The decisive part of the figures included in HCSO Monitor are downloadable in both image and data formats (PNG, SVG and CSV). Feel free to browse the data in HCSO Monitor, updated many times a week!
UEFA Champions League final – Budapest, 2026
The tournament of European elite men’s clubs (formerly named European Champion Clubs’ Cup) has been organised by UEFA, the Union of European Football Associations every year since 1955. The final of the event, named Champions League since the 1992/93 season, will be held for the first time in Hungary. The match will take place on 30 May 2026 in Budapest, in the Puskás Aréna – named after Ferenc Puskás, the legendary, three-time European Cup winner footballer –, where Arsenal and Paris Saint-Germain will fight for the trophy, and the latter as the defending champion.

Born 100 Years Ago: László Papp, Three-Time Olympic Champion Boxer
László Papp – affectionately known as “Papp Laci” by the nation – was born on 25 March 1926. He won his first Olympic gold medal in the middleweight division at the 1948 London Games, then triumphed again in light middleweight in Helsinki (1952) and Melbourne (1956). With these victories, he became the first boxer in history to win gold at three consecutive Olympic Games. As a professional, he captured the European middleweight title in 1962 and went on to defend it six times. Out of his 29 professional bouts, he won 27, including 11 by knockout.

Hungarians at Winter Olympics
The 25th Winter Olympic Games are held in Milan and Cortina d’Ampezzo in Italy between 6 and 22 February 2026. Athletes from nearly a hundred countries take part at the series, and Olympic champions will be declared in 116 events. There will be a new event, too, at the tournament: ski mountaineering. Hungary is represented by 16 athletes, who will test their strength in alpine skiing, figure skating, speed skating, short-track speed skating, cross-country skiing and snowboard.

Super Bowl LX
The Super Bowl attracts a huge viewership not only in the United States, but in Hungary, too, in spite of the fact that the game starts after midnight Hungary’s time and ends around 4 a.m. Many pubs and restaurants in our country are closing later that day so that fans don't miss out on the shared excitement, even certain movie theatres offer an opportunity to watch the event. This year's finals will be between the Seattle Seahawks and the New England Patriots. Leading up to kickoff, we brought some exciting numbers and interesting facts for Super Bowl fans from the history of the NFL Finals.
When the Hungarian movie makes once again a bang – Movie hits after 1990
In spite of digital content proliferation, the magic of movies still draws millions of people to the movie theatres. In Hungary, 378 new feature films were released in 2024 – 6% more than in the previous year – out of these 47 were Hungarian feature films. The first Hungarian movie (Béla Zsitkovszky and Gyula Pekár's The Dance) premiered in 1901, while in recent times (from the end of 2024 to the present day) news reported about the triumph of two Hungarian films.
Day of the Hungarian Culture
January 22 is the Day of Hungarian Culture since 1989, in memory of the day when Ferenc Kölcsey completed the manuscript of the Anthem in 1823. The holiday aims to draw attention to the values of Hungarian culture. The Nobel Prize in Literature was awarded in 2025 to László Krasznahorkai, the second Hungarian writer to receive this prestigious prize. The total number of published literary, young adults' and children's books by Hungarian authors exceeded between the first and the third quarters of 2025, too, those published by foreign ones.
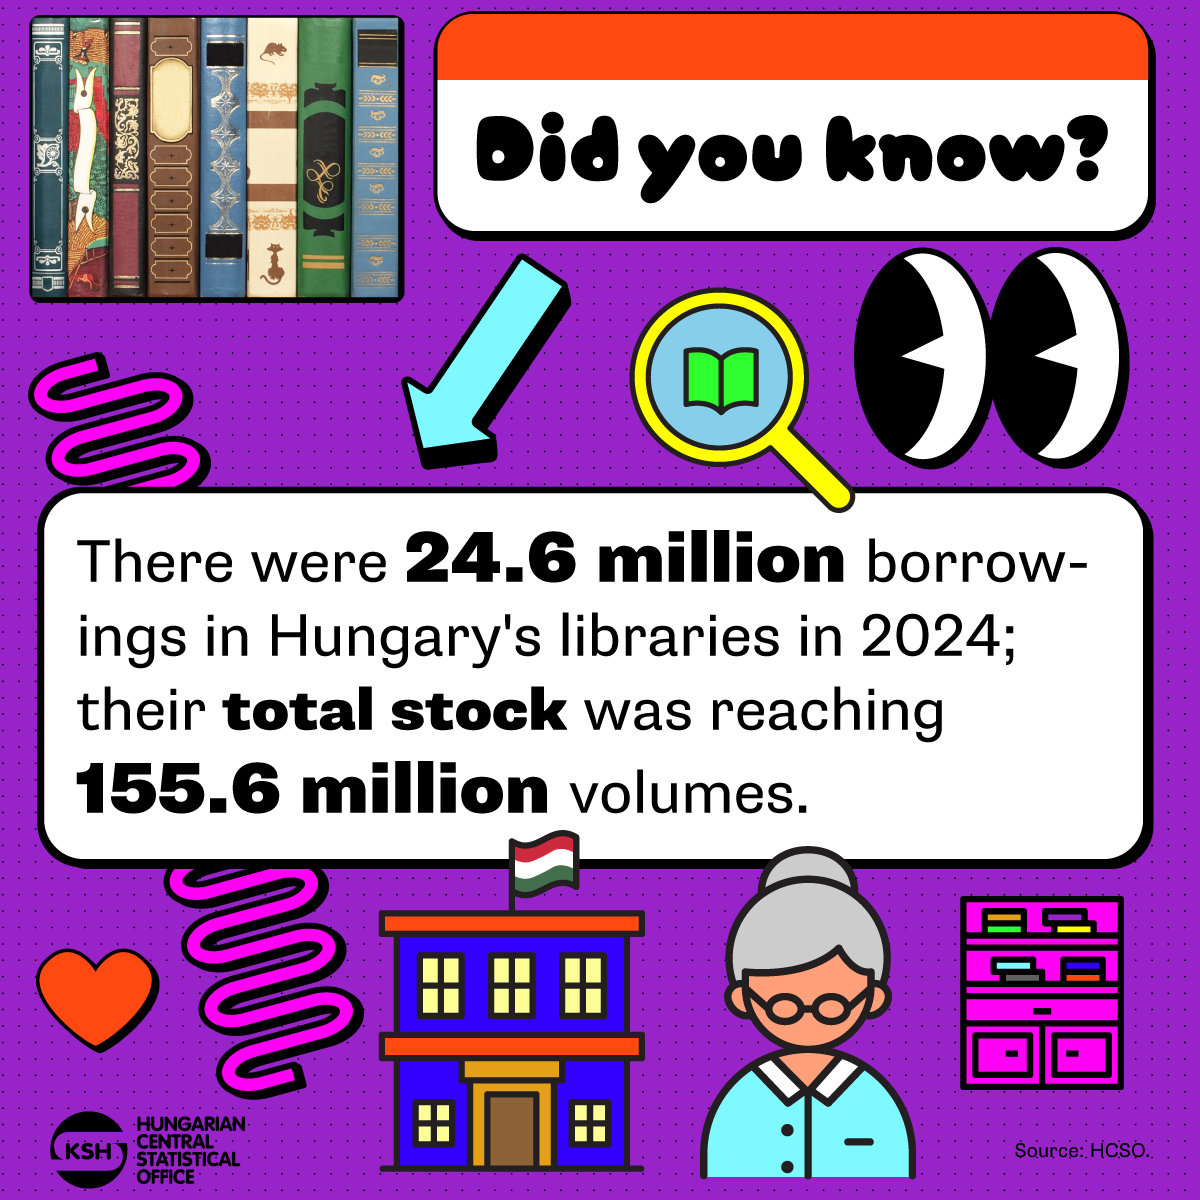
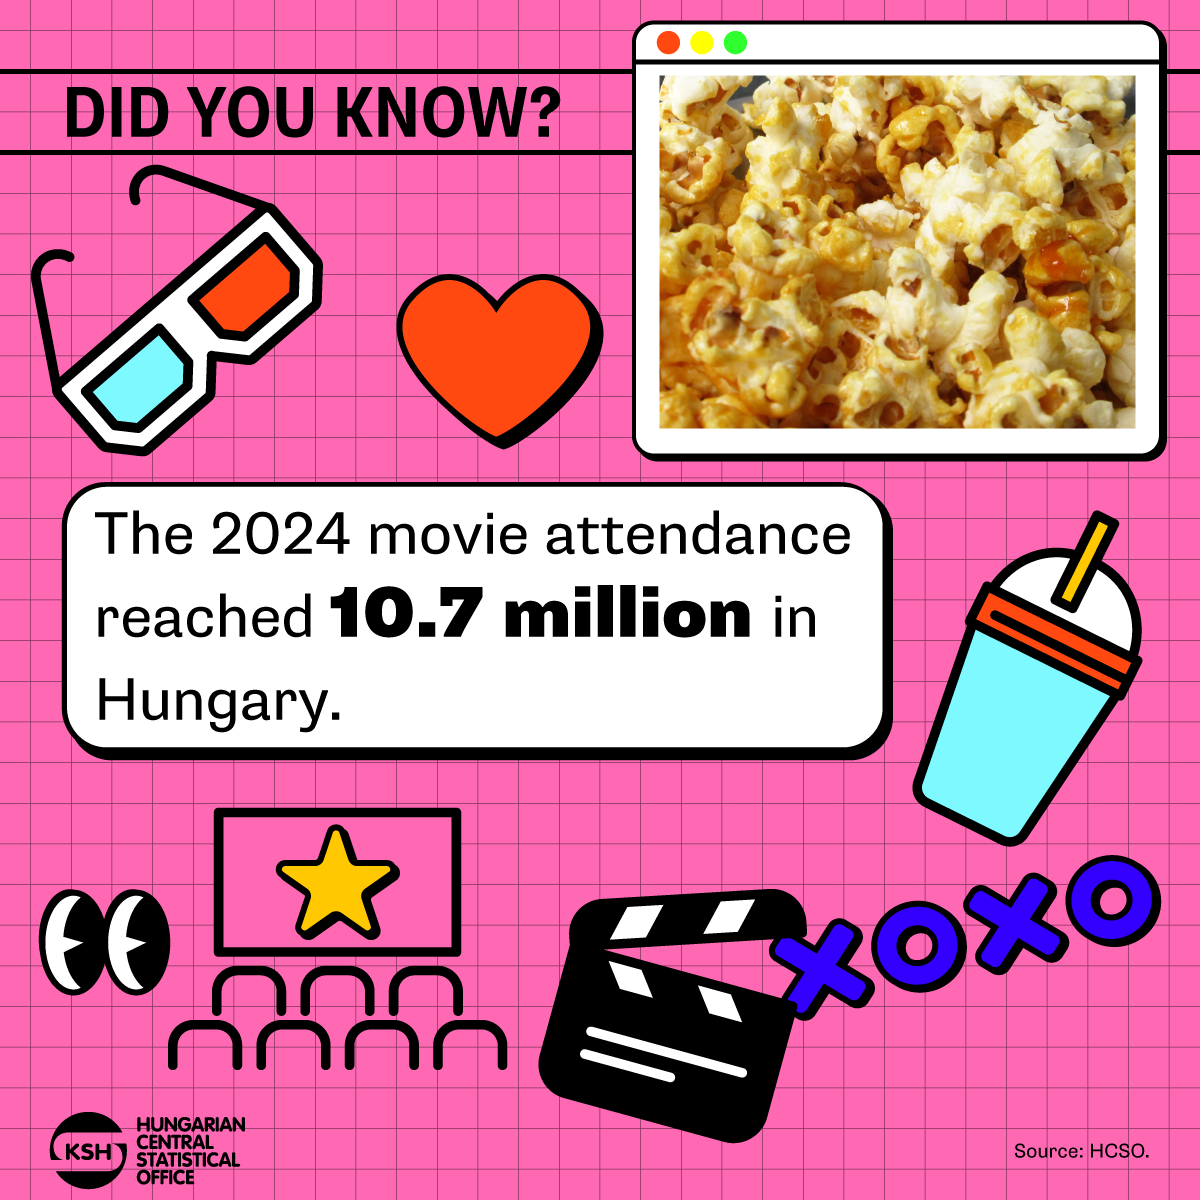
Did you know? – Book
14,298 books have been published in Hungary in 2024, in 30 million copies.
If you liked it, check out our data visualisations at this link: www.ksh.hu/datavisualisations
If you liked it, check out our data visualisations at this link: www.ksh.hu/datavisualisations

Snapshots, 2024 – Culture
Hungarian radio broadcasting is 100-year-old. The first broadcast started on 1 December 1925 with a festive concert. The popularity of music programs is continuous ever since, their share in the total broadcast time was 62% in 2024.An ever-growing proportion of Hungary’ cinema seats – 42% in 2024 – are concentrated in multiplex cinemas with 8 or more auditoriums. Attendance of Hungarian films broke the record this year, out of the 10.7 million cinema tickets sold 14.5% were for domestic films.
Statistical Yearbook of Hungary, 2024
The yearbook provides an overview of Hungary's demographic, social and economic trends, environmental characteristics and their changes over time, with the help of tens of thousands of data in some 500 tables, charts and maps. In the chapter devoted to earnings and incomes, it is a novelty compared to previous years that net earnings in which allowances and types of exemptions are accounted for, too, came into focus from 2019. In the number of employees, people working in working time shorter than 60 working hours per month are also taken into account. In addition, the theme of environment is completed with areas declared world heritage sites by UNESCO.

Settlement and district related data regarding 2022 are presented here
Datasets from the Dissemination Database regarding settlements and Budapest’s districts have been updated with 2022 data, as such settlement and district related data for 2022 are available since 31 August, concerning, among others, data on cinemas.
Related themes
Methodological information
Dissemination database ( infra-annual data annual data ) |
Latest update | Next update |
|---|---|---|
Radio and TV broadcasters | ||
| Broadcasting time in hour | 09/09/2025 | 09/09/2026 |
| Broadcasting by languages | 09/09/2025 | 09/09/2026 |
| Programme service | 09/09/2025 | 09/09/2026 |
Book production | ||
| Juvenile and children's literary | 24/04/2026 | – |
| Books and booklets by published language | 24/04/2026 | – |
| Books and booklets by nationality of author | 24/04/2026 | – |
| Number of books and booklets by number of copies | 24/04/2026 | – |
| Books and booklets by subject | 24/04/2026 | – |
| Literary works by genre | 24/04/2026 | – |
| Types of publication | 24/04/2026 | – |
| Schoolbooks by educational level | 24/04/2026 | – |
Cinema, films | ||
| Feature-length films | 16/10/2025 | 16/10/2026 |
| Traffic data of cinemas | 16/10/2025 | 16/10/2026 |
| Number of screens in cinemas | 16/10/2025 | 16/10/2026 |
Data visualisations