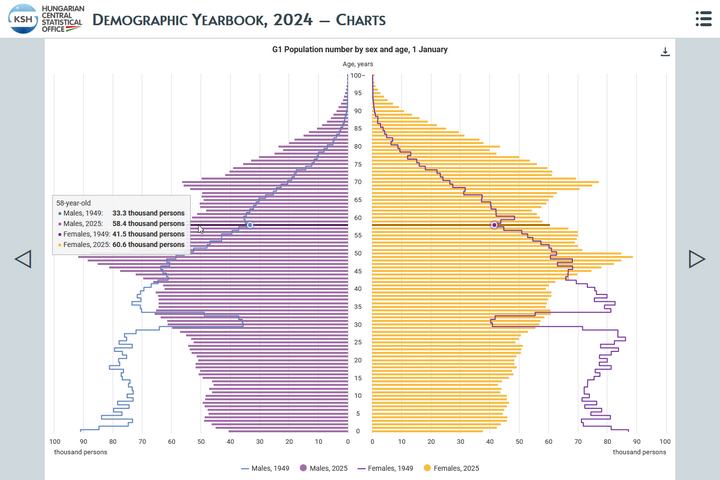
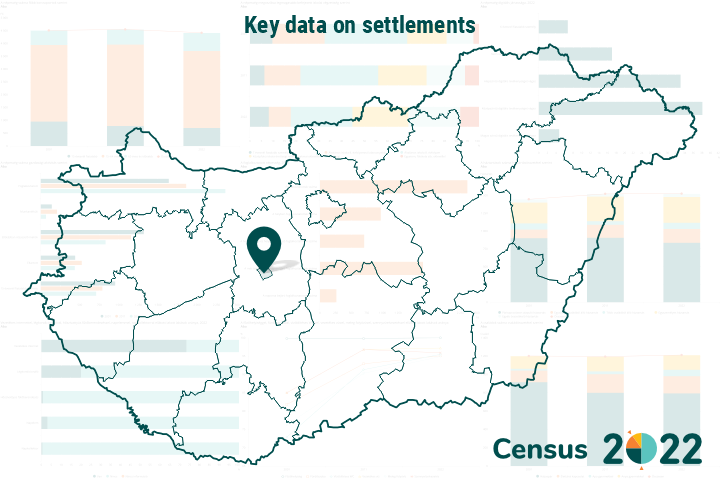
Population and vital events
Population statistics show the change in the country’s population number and its composition by sex, age and marital status. Statistics relating to vital events provide information on factors basically influencing changes in population, such as births, deaths, marriages, registered partnerships, divorces, as well as internal and international migrations.
Key figures
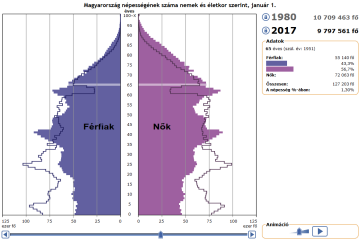
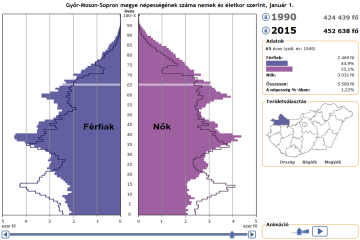
Adjusted population number
Indicator description
The full-scope censuses conducted every ten years show a comprehensive picture of the number and composition of the population. For determining the annual population number in the period between two censuses, the starting point is the population number of the last census (currently the census with the reference date of 1 October 2022) , and from this, the population was estimated by using natural increase or decrease data available from the statistics of vital events until 2000. From 2001 international migration is also taken into account.
Source of data:
Summary Tables (STADAT)
Last data for period: 2026
Natural increase/decrease per thousand population
Indicator description
Difference between the number of live births and deaths, per thousand population.
Source of data:
Summary Tables (STADAT)
Last data for period: April 2026
Average life expectancy at birth
Indicator description
Average life expectancy expresses how many further years of lifetime can be expected by people of various ages at the mortality rate of the given year.
Source of data:
Summary Tables (STADAT)
Last data for period: 2025
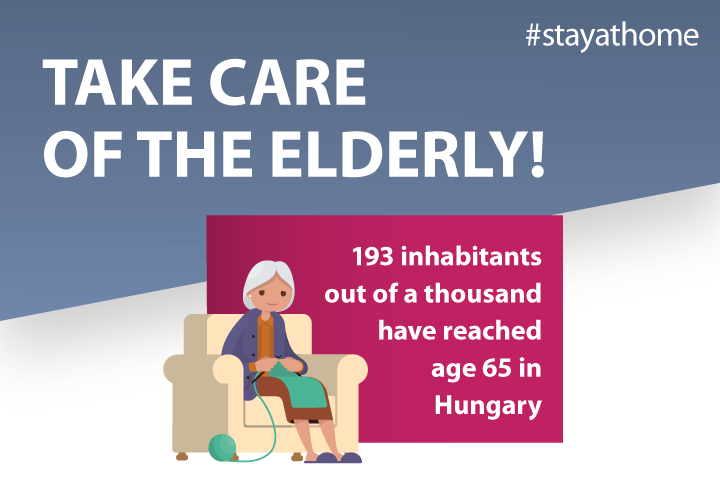
Ageing index
Indicator description
The 65 year-old and older population as a percentage of the 14 year-old and younger child population. If it is higher than 100, the number of the old-age population is higher than that of the child population.
Source of data:
Summary Tables (STADAT)
Last data for period: 2025
Featured
HCSO Monitor
The collection of interactive figures provides up-to-date information on the latest domestic and international socio-economic trends. The decisive part of the figures included in HCSO Monitor are downloadable in both image and data formats (PNG, SVG and CSV). Feel free to browse the data in HCSO Monitor, updated many times a week!

5,410 children are born and 9,946 people lose their lives; Vital events, April 2026
According to preliminary data, 5,410 children were born and 9,946 people died in April 2026. The number of births rose by 1.3% and that of deaths by 0.2%, while the number of marriages lessened by 14% compared to the same month of the previous year.
Hungary in figures, 2024
Hungary’s population on 1 January 2024 was 9 million 585 thousand people, with nearly 18% living in the capital city, almost 53% in towns, and 30% in villages. In 2023, Hungary’s trade surplus in goods reached its highest level since 2016 (9.0 billion euros), while the surplus in services also rose to a record high (11.0 billion euros). Both the production volume and average yield of the major arable crops increased; the production of barley reached an unprecedented level of 2.2 million tonnes.
Day of Szeged
The free royal city of Szeged received its charter from King Charles III on 21 May 1719: this date has been celebrated as the city’s official day since 1990. In 1962, it became the seat of the then Csongrád County. Today it is the second most populous city outside Budapest. It is a cultural, educational, and economic centre. Its theatre, the Szeged Open-Air Festival, and its higher education institutions all have a long and distinguished history. In recent decades, its economy has shifted from the food industry—paprika, Pick salami, and its canning factory—toward vehicle manufacturing.

Mother’s Day, 2026
Mother’s Day is celebrated worldwide—in most countries on the second Sunday of May—, while in Hungary it is a centuries-old tradition to greet mothers on the first Sunday of May. On this special day, children and adults can express their gratitude not only to the more than 3 million Hungarian mothers, but also to grandmothers for their love and care.

Nurseries Day
Nurseries Day in Hungary is celebrated on 21 April, marking the opening of the country’s first nursery in 1852. In 2025, more than 62 thousand young children were receiving daytime care in 2,990 institutions. The number of enrolled children showed steady growth over the years—apart from 2020, which was affected by the COVID-19 pandemic—and in 2025, nurseries cared for 42% more children than eight years earlier. Most young children attended traditional nurseries; however, from 2017, the number of children using mini infant nursery services grew at the fastest rate.
TÉR-KÉP, 2024 – Countries of the Visegrad Cooperation (V4)
If the Visegrad Four (V4) would be considered as one single country, it would be the third most populous state and the fifth largest economy within the EU. Hungary registered the highest median age among the four countries, at the same time the proportion of those using the internet was on average the highest in our country. The economic activity indices of the V4 countries were more favourable than the EU average. The complete publication is available in Hungarian at: TÉR-KÉP, 2024

Hungary 1st-3rd quarters of 2025 – Continuously increasing consumption
The performance of Hungary’s economy surpassed the previous year’s level by 0.3% in the 1st-3rd quarters of 2025. The increasing performance of the services sector and construction as well as growing consumption had a positive impact on GDP. These impacts however have been subdued by the setback of the industry and agriculture, the continuously subdued investment activity. Retail trade volume continued to rise, foreign demand at accommodation establishments increased, too.

Current trends in internal migration, 2018–2024
The number of permanent migrants increased significantly during the coronavirus pandemic, and then it decreased significantly in 2022 and especially in 2023, but increased again in 2024. During the pandemic, migration was directed from larger settlements to smaller ones; however, from 2023, there was a migration gain in the capital city, while the gains in the villages declined significantly.

Statistical Yearbook of Hungary, 2024
The yearbook provides an overview of Hungary's demographic, social and economic trends, environmental characteristics and their changes over time, with the help of tens of thousands of data in some 500 tables, charts and maps. In the chapter devoted to earnings and incomes, it is a novelty compared to previous years that net earnings in which allowances and types of exemptions are accounted for, too, came into focus from 2019. In the number of employees, people working in working time shorter than 60 working hours per month are also taken into account. In addition, the theme of environment is completed with areas declared world heritage sites by UNESCO.

Hungary, 2024
Hungary’s GDP increased by 0.5% amid global challenges in 2024. The performance of goods-producing industries lessened, while that of service-providing ones rose, which shows the duality of economic trends. Household consumption picked up, which was considerably encouraged by the purchasing power of earnings growing again with the inflationary wave calming down. Besides, the data series reveal that the level of employment reached another peak.

Snapshots, 2024 - Vital events
In Hungary, fewer children were born in 2024 than a year earlier. The number of deaths also declined, but to a lesser extent than the number of births, so the rate of natural decrease accelerated. A lower surplus of international migration than in the previous year slightly reduced the population decrease, and the country's population fell by 45 thousand people. The number of marriages fell short of the previous year, while the number of divorces slightly exceeded it.
Related themes
- Censuses
- Health care, accidents
- Housing
- Income and consumption
- Justice
- Labour
- Living conditions
- Men and women
- Regional statistics
- The young and the elderly
Methodological information
First releases |
Latest release | Next release |
|---|---|---|
| Vital events, April 2026 | 29/05/2026 | 26/06/2026 |
Release and revision calendarPublication repertory
Data visualisations