Industry
Statistics on industry comprises three sections (mining and quarrying, manufacturing, energy industry). Extraction of natural minerals, transformation of basic materials and products into new products, electricity, gas, steam, hot water supply are defined as industrial activities. Beside industry significantly influencing economic performance, the division group also has an important role in employment. Industrial statistics offers information – beside production data – about sales directions (domestic and export sales) as well as about orders relating to industrial products and services and their change over time.
Key figures
Share of industry in gross added value
Indicator description
Share of industry (mining and quarrying, manufacturing, energy industry) in the national economy’s gross added value, calculated at current base price.
Source of data:
Summary Tables (STADAT)
Last data for period: 2024
Volume change in domestic sales of industry
Indicator description
Change in net sales revenue coming from industrial products and services produced and sold in Hungary compared to the same period of the previous year, adjusted with the sales price changes in domestic sales, adjusted for working day.
Source of data:
Summary Tables (STADAT)
Last data for period: March 2026
Volume change in export sales of industry
Indicator description
Change in net sales revenue coming from industrial products and services sold abroad compared to the same period of the previous year, adjusted with the sales price changes in export sales, working day adjusted.
Source of data:
Summary Tables (STADAT)
Last data for period: March 2026
Volume change in industrial production
Indicator description
We measure changes in industrial production by variations in the value of industrial production, while eliminating the impact of the price change. We calculate the volume index of production using industrial production value data given at comparative prices (expressed at reference-period price levels) and working day adjusted.
Source of data:
Summary Tables (STADAT)
Last data for period: April 2026
Featured

Industrial production increased by 0.9% year-on-year and declined by 1.1% compared to the previous month; Industry, April 2026 (first estimate)
The volume of industrial production grew by 0.9% year-on-year in April 2026. The working-day adjusted index is equal to the non-adjusted one. According to seasonally and working-day adjusted data, industrial output was 1.1% lower than in March 2026.
HCSO Monitor
The collection of interactive figures provides up-to-date information on the latest domestic and international socio-economic trends. The decisive part of the figures included in HCSO Monitor are downloadable in both image and data formats (PNG, SVG and CSV). Feel free to browse the data in HCSO Monitor, updated many times a week!
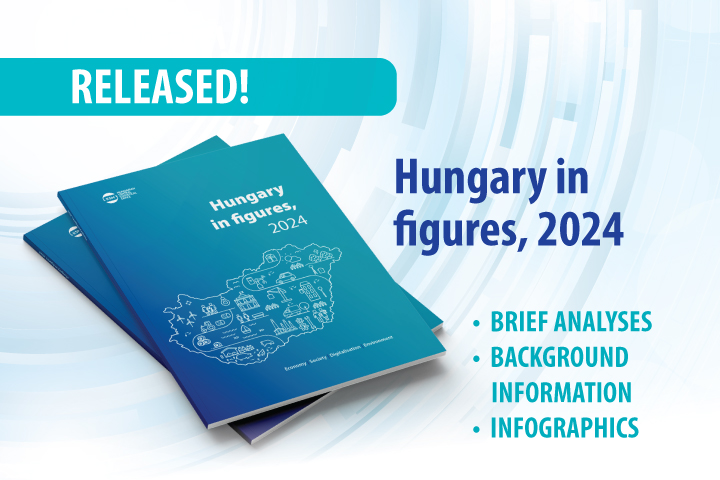
Hungary in figures, 2024
Hungary’s population on 1 January 2024 was 9 million 585 thousand people, with nearly 18% living in the capital city, almost 53% in towns, and 30% in villages. In 2023, Hungary’s trade surplus in goods reached its highest level since 2016 (9.0 billion euros), while the surplus in services also rose to a record high (11.0 billion euros). Both the production volume and average yield of the major arable crops increased; the production of barley reached an unprecedented level of 2.2 million tonnes.
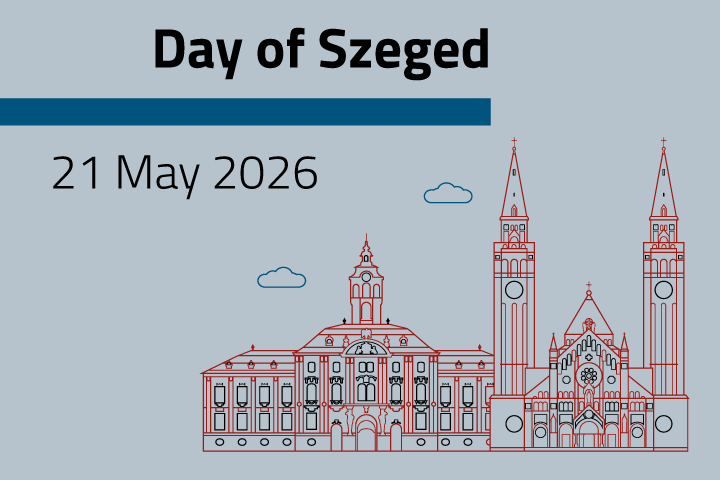
Day of Szeged
The free royal city of Szeged received its charter from King Charles III on 21 May 1719: this date has been celebrated as the city’s official day since 1990. In 1962, it became the seat of the then Csongrád County. Today it is the second most populous city outside Budapest. It is a cultural, educational, and economic centre. Its theatre, the Szeged Open-Air Festival, and its higher education institutions all have a long and distinguished history. In recent decades, its economy has shifted from the food industry—paprika, Pick salami, and its canning factory—toward vehicle manufacturing.

Hungary 1st-3rd quarters of 2025 – Continuously increasing consumption
The performance of Hungary’s economy surpassed the previous year’s level by 0.3% in the 1st-3rd quarters of 2025. The increasing performance of the services sector and construction as well as growing consumption had a positive impact on GDP. These impacts however have been subdued by the setback of the industry and agriculture, the continuously subdued investment activity. Retail trade volume continued to rise, foreign demand at accommodation establishments increased, too.

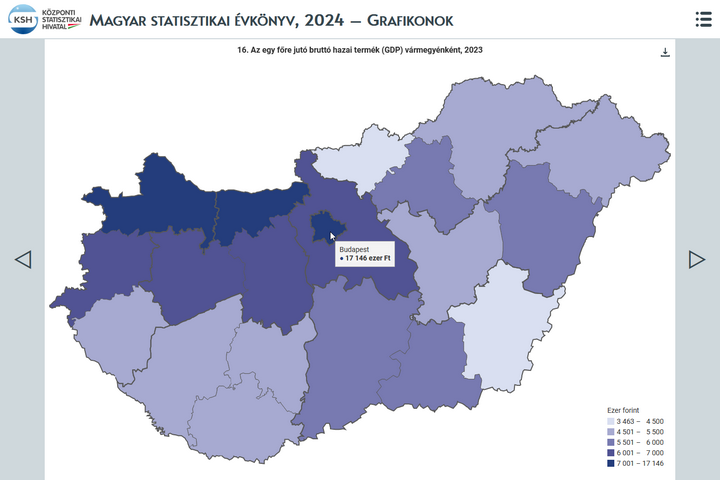
Statistical Yearbook of Hungary, 2024
The yearbook provides an overview of Hungary's demographic, social and economic trends, environmental characteristics and their changes over time, with the help of tens of thousands of data in some 500 tables, charts and maps. In the chapter devoted to earnings and incomes, it is a novelty compared to previous years that net earnings in which allowances and types of exemptions are accounted for, too, came into focus from 2019. In the number of employees, people working in working time shorter than 60 working hours per month are also taken into account. In addition, the theme of environment is completed with areas declared world heritage sites by UNESCO.

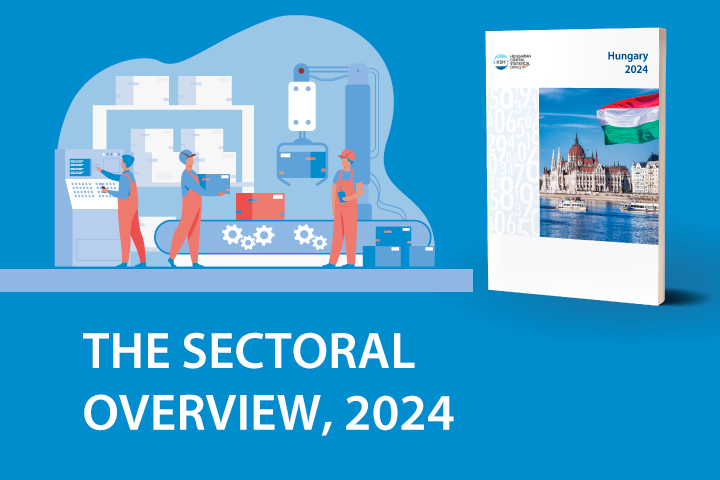
Snapshots, 2024 - Industry
The volume of domestic industrial production was 4.0% lower in 2024 year-on-year. Output lessened in nine of the – great majority of production ensuring - manufacturing subsections, most of all in the manufacture of electrical equipment. Output in the largest weight representing vehicle production decreased as well. Food industry, however, enhanced its performance.

Hungary, 2024
Hungary’s GDP increased by 0.5% amid global challenges in 2024. The performance of goods-producing industries lessened, while that of service-providing ones rose, which shows the duality of economic trends. Household consumption picked up, which was considerably encouraged by the purchasing power of earnings growing again with the inflationary wave calming down. Besides, the data series reveal that the level of employment reached another peak.
Related themes
Methodological information
First releases |
Latest release | Next release |
|---|---|---|
| Industry, April 2026 (first estimate) | 05/06/2026 | 06/07/2026 |
| Industry, March 2026 (second estimate) | 13/05/2026 | 12/06/2026 |
Data visualisations