National accounts, GDP
National accounts are a system of macro-economic statistical accounts, summarising the economic activities of a particular country, which compares resources with their uses. The data, produced according to the methodology of the European system of national accounts (ESA), are suitable for international comparison, too. The best known and mostly used indicator of the system of accounts is gross domestic product (GDP), the level and volume change of which are key indicators to evaluate the level of development and growth of the economy.
Key figures
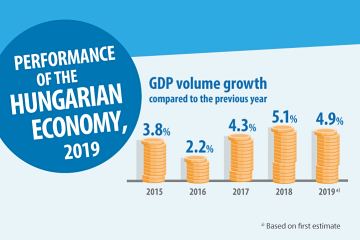
GDP volume change
Indicator description
Change in volume of GDP compared to the same period of the previous year. The volume figure published here is unadjusted.
Source of data:
Summary Tables (STADAT)
Last data for period: Q1 2026
Value of GDP per capita, calculated in purchasing power parity
Indicator description
Value of GDP divided by population number, calculated in purchasing power parity. The indicator is suitable for analysing the level of economic development.
Source of data:
Summary Tables (STADAT)
Last data for period: 2024
GNI/GDP ratio
Indicator description
Gross national income (GNI) divided by gross domestic product (GDP). GNI can be derived from GDP. If the value of GNI exceeds that of GDP, then more income flows from abroad to the country than from the country abroad, while in the other way round income outflow occurs.
Source of data:
Summary Tables (STADAT)
Last data for period: 2024
Balance of general government sector as a proportion of GDP
Indicator description
Difference of total revenues and expenditures in proportion of GDP of organisations classified into the general government, in a given quarter.
Source of data:
Summary Tables (STADAT)
Last data for period: Q4 2025
Featured
HCSO Monitor
The collection of interactive figures provides up-to-date information on the latest domestic and international socio-economic trends. The decisive part of the figures included in HCSO Monitor are downloadable in both image and data formats (PNG, SVG and CSV). Feel free to browse the data in HCSO Monitor, updated many times a week!
Economic performance 1.7% higher in 1st quarter 2026 than in 1st quarter 2025; Gross domestic product (GDP), 1st quarter 2026 (second estimate)
The volume of Hungary’s gross domestic product was 1.7% higher according to both raw and seasonally and calendar adjusted and reconciled data in the 1st quarter of 2026 than in the corresponding period of the previous year. Compared to the previous quarter, the economic performance rose by 0.8% according to seasonally and calendar adjusted and reconciled data.
Hungary in figures, 2024
Hungary’s population on 1 January 2024 was 9 million 585 thousand people, with nearly 18% living in the capital city, almost 53% in towns, and 30% in villages. In 2023, Hungary’s trade surplus in goods reached its highest level since 2016 (9.0 billion euros), while the surplus in services also rose to a record high (11.0 billion euros). Both the production volume and average yield of the major arable crops increased; the production of barley reached an unprecedented level of 2.2 million tonnes.

Quarterly non-financial sector accounts, 4th quarter 2025
According to seasonally and calendar adjusted data, financial corporations as well as households and non-profit institutions serving households (NPISHs) were in a net lending, while non-financial corporations and general government in a net borrowing position in the 4th quarter of 2025. The gross saving rate of households and NPISHs came to 16% and their gross investment rate to 5.5%. The gross profit share of non-financial corporations reached 38% and their gross investment rate 30%.
Hungary joined the OECD 30 years ago
Hungary became a member of the Organisation for Economic Co?operation and Development (OECD) 30 years ago, on 7 May 1996. The Organisation currently has 38 member countries, including Hungary. In 2024, OECD countries accounted for 17% of the world’s population and 43% of global GDP. Hungary’s GDP per capita at purchasing power parity stood at 77.4% of the OECD average in 2025, an increase of 32.6 percentage points compared with 1996.
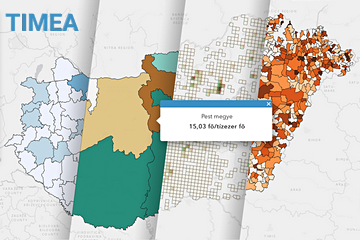
TÉR-KÉP, 2024 – Countries of the Visegrad Cooperation (V4)
If the Visegrad Four (V4) would be considered as one single country, it would be the third most populous state and the fifth largest economy within the EU. Hungary registered the highest median age among the four countries, at the same time the proportion of those using the internet was on average the highest in our country. The economic activity indices of the V4 countries were more favourable than the EU average. The complete publication is available in Hungarian at: TÉR-KÉP, 2024

Hungary 1st-3rd quarters of 2025 – Continuously increasing consumption
The performance of Hungary’s economy surpassed the previous year’s level by 0.3% in the 1st-3rd quarters of 2025. The increasing performance of the services sector and construction as well as growing consumption had a positive impact on GDP. These impacts however have been subdued by the setback of the industry and agriculture, the continuously subdued investment activity. Retail trade volume continued to rise, foreign demand at accommodation establishments increased, too.

Hungary’s national accounts, 2024 (second preliminary data)
Hungary’s gross domestic product (GDP) at current prices was HUF 81,447.7 billion in 2024, increasing by 0.6% at constant prices compared to the previous year. The amount of gross domestic product per capita was HUF 8.5 million, or EUR 30,391 in purchasing power standard. The deficit of the general government sector was HUF 4,089.6 billion, or 5.0% of GDP, according to the preliminary data of national accounts.

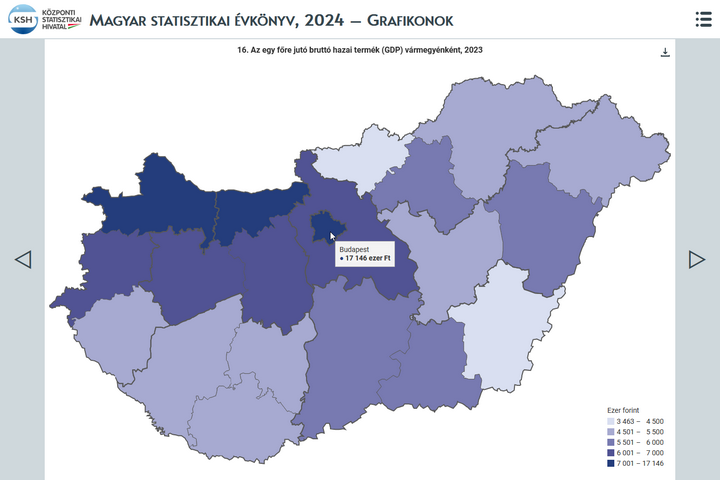
Statistical Yearbook of Hungary, 2024
The yearbook provides an overview of Hungary's demographic, social and economic trends, environmental characteristics and their changes over time, with the help of tens of thousands of data in some 500 tables, charts and maps. In the chapter devoted to earnings and incomes, it is a novelty compared to previous years that net earnings in which allowances and types of exemptions are accounted for, too, came into focus from 2019. In the number of employees, people working in working time shorter than 60 working hours per month are also taken into account. In addition, the theme of environment is completed with areas declared world heritage sites by UNESCO.

Hungary, 2024
Hungary’s GDP increased by 0.5% amid global challenges in 2024. The performance of goods-producing industries lessened, while that of service-providing ones rose, which shows the duality of economic trends. Household consumption picked up, which was considerably encouraged by the purchasing power of earnings growing again with the inflationary wave calming down. Besides, the data series reveal that the level of employment reached another peak.
Related themes
- Culture, sports
- Education
- External trade and balance of payments
- Government finance
- Investment
- Regional statistics
- Science and technology
Methodological information
First releases |
Latest release | Next release |
|---|---|---|
| Balance of general government sector, year 2025 and the 4th quarter of 2025 | 01/04/2026 | 01/07/2026 |
| Gross domestic product (GDP), 1st quarter 2026 (flash estimate) | 30/04/2026 | 30/07/2026 |
| Gross domestic product (GDP), 1st quarter 2026 (second estimate) | 02/06/2026 | 01/09/2026 |
Release and revision calendarPublication repertory
Data visualisations