Living conditions
The living conditions and living standard of the population can be represented, among other things, by the indicators of poverty, social exclusion, income situation by social strata, data on consumption. Size and composition of households, families belong here, too.
Key figures
Relative at-risk-of-poverty rate
Indicator description
Share of persons living in households with an income below 60 % of the median equivalised income. Median equivalised income: after ranking the total population on the basis of the income per OECD 2 consumption unit, the median income is in the middle of the line, i.e. the number of population with less and that of population with more income is the same.
Source of data:
Summary Tables (STADAT)
Last data for period: 2024
Severe material and social deprivation rate
Indicator description
Severe material and social deprivation refers to persons who experience at least seven of the thirteen problems listed below: cannot afford
- a week of holiday away from home annually,
- to face unexpected expenses,
- to eat meat, fish or a protein equivalent every second day,
- to avoid arrears (in mortgage/house loan, rent, utility bills and/or hire purchase instalments),
- to keep home adequately warm,
- have access to a car/van for personal use,
- to replace worn-out furniture,
- to replace worn-out clothes with new ones,
- having two pairs of properly fitting shoes (including a pair of all-weather shoes),
- to get together with friends/family for a drink/meal at least once a month,
- to have regular leisure activities,
- to spend a small amount of money each week on themselves (pocket money),
- having an internet connection.
Source of data:
Summary Tables (STADAT)
Last data for period: 2024
Share of people living in households with very low work intensity
Indicator description
Share of people living in households where people of working age (aged 18–64) work less than 20% of their total work potential during the past year.
Source of data:
Summary Tables (STADAT)
Last data for period: 2024
Share of people at risk of poverty or social exclusion
Indicator description
Share of people within the total population who are affected by at least one of the followings: at-risk-of-poverty, severe material and social deprivation or living in households with very low work intensity.
Source of data:
Summary Tables (STADAT)
Last data for period: 2024
Featured
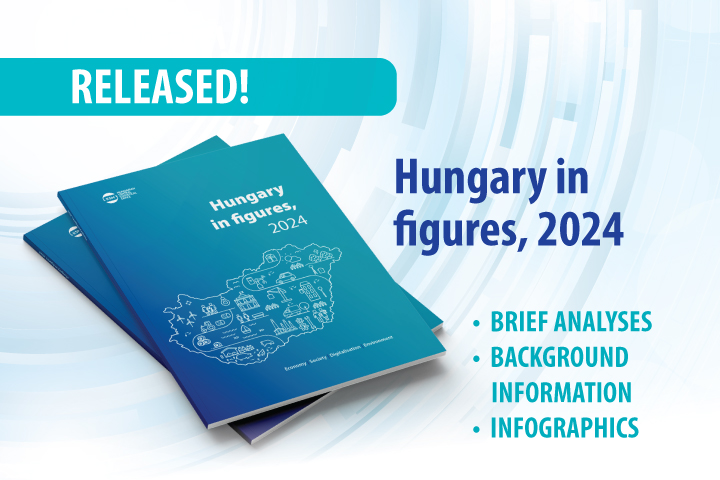
Hungary in figures, 2024
Hungary’s population on 1 January 2024 was 9 million 585 thousand people, with nearly 18% living in the capital city, almost 53% in towns, and 30% in villages. In 2023, Hungary’s trade surplus in goods reached its highest level since 2016 (9.0 billion euros), while the surplus in services also rose to a record high (11.0 billion euros). Both the production volume and average yield of the major arable crops increased; the production of barley reached an unprecedented level of 2.2 million tonnes.

Snapshots, 2024 – The living standard of households
Gross yearly income per capita in Hungary was 3 million 673 thousand HUF in 2024, the net yearly income per capita amounted to 2 million 797 thousand HUF, the former increasing by 12.2%, the latter by 13.6% year-on-year. At the same time the income of the richest people grew faster than that of the poorest, the relative condition of the latter got worse as a result. The number of people at risk of poverty or social exclusion stagnated in 2024 year-on-year, with 1 million 819 thousand people in the affected group.
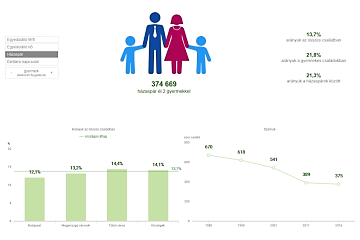
Hungary in figures, 2023 – Highlighted data
At the aid of our infographic made using the main data in our publication titled Hungary in figures, 2023, we give a comprehensive picture of the socio-economic state of Hungary. There were 1,073 females per thousand males in Hungary at the beginning of 2024. Life expectancy at birth rose to the highest level yet in 2023 (to 73.4 years for males and 79.6 years for females). Over a quarter of manufacturing output was made up by the manufacture of transport equipment.
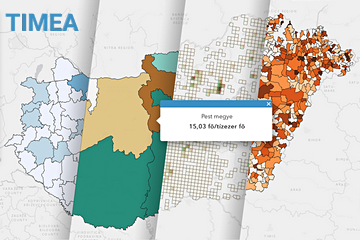
Hungary 2024 – The Living Conditions
Our series of infographics, based on the most important data from the Hungarian-language publication Hungary, 2024 provides a comprehensive picture of the social and economic state of our country and the main characteristics of our environment. The next infographic in the series presents the main data of the living conditions. The English extract from the publication is available here: Hungary, 2024, and the full Hungarian-language version here: Magyarország, 2024.

Hungary, 2024
Hungary’s GDP increased by 0.5% amid global challenges in 2024. The performance of goods-producing industries lessened, while that of service-providing ones rose, which shows the duality of economic trends. Household consumption picked up, which was considerably encouraged by the purchasing power of earnings growing again with the inflationary wave calming down. Besides, the data series reveal that the level of employment reached another peak.
Related themes
- Housing
- Income and consumption
- Men and women
- Population and vital events
- Social care protection
- Time use
- The young and the elderly
Methodological information
Data visualisations