Social care protection
Certain members of the society are entitled to certain benefits, provided in cash, in kind or as institutional social services, on a universal basis or on the basis of need or the principle of merit. Welfare statistics takes into account the system of institutions and benefits related to illness, old age, survivors, child raising, family and children, unemployment, housing and social exclusion, as well as the sources of their maintenance.
Key figures
Social protection benefits as a percentage of GDP
Indicator description
Social protection benefits calculated according to the EU methodology as a percentage of the gross domestic product.
Source of data:
Summary Tables (STADAT)
Last data for period: 2024
The pensions and other provisions as a percentage of average net nominal earnings
Indicator description
Average monthly amount of benefits in cash per recipient paid by the Pension Payment Directorate as a percentage of average net nominal earnings.
Source of data:
Summary Tables (STADAT)
Last data for period: 2025
Number of active places in infant nurseries
Indicator description
Number of active places in infant nurseries (on 1 May of the reference year; infant nursery, mini infant nursery, workplace infant nursery, family infant nursery together).
Source of data:
Summary Tables (STADAT)
Last data for period: 2025
Expenditure on family benefits as a percentage of GDP
Indicator description
Total amount of expenditure spent on family allowance, maternity allowance, child care allowance, child raising support, infant care benefit and child care as a percentage of GDP.
Source of data:
Summary Tables (STADAT)
Last data for period: 2025
Featured

Snapshots, 2025 – Social protection
In 2025, nearly 73 thousand children were registered as being at risk in Hungary, of whom guardianship authorities placed almost 34 thousand minors under protection. The child protection specialist care system has undergone significant changes in recent years: the emphasis has shifted from institutional care to foster placement, and the role of religious organisations has increased considerably. Approximately 360 thousand persons used basic social services. Residential institutions providing long-term and temporary placement cared for more than 87 thousand beneficiaries.

Snapshots, 2025 – Pensions and other benefits
At the beginning of 2026, 2,421 thousand people in Hungary received a pension or other pension benefits, and 77% of the people entitled received an old-age pension over retirement age. Those receiving a pension or other benefits received an average of 240 thousand forints as full benefits. The average amount of old-age pension equalled 261 thousand forints, with men’s benefits 44 thousand forints higher than women’s, due to the typically longer service time and higher earnings.

Nurseries Day
Nurseries Day in Hungary is celebrated on 21 April, marking the opening of the country’s first nursery in 1852. In 2025, more than 62 thousand young children were receiving daytime care in 2,990 institutions. The number of enrolled children showed steady growth over the years—apart from 2020, which was affected by the COVID-19 pandemic—and in 2025, nurseries cared for 42% more children than eight years earlier. Most young children attended traditional nurseries; however, from 2017, the number of children using mini infant nursery services grew at the fastest rate.

Snapshots, 2024 - Benefits and allowances
Family-policy benefits (direct and indirect together) exceeded 4% of GDP in Hungary in the last five years. Out of direct family benefits, family allowance was paid to 1,050 thousand families in 2024. 858 thousand people received local social benefit, and local governments spent a total of 25.3 billion forints on subsidisation, which was nearly 29,500 forints per capita on an annual average. Nearly 1 million parents benefitted from family tax allowance, its total amount exceeding 360 billion forints.
Statistical Yearbook of Hungary, 2024
The yearbook provides an overview of Hungary's demographic, social and economic trends, environmental characteristics and their changes over time, with the help of tens of thousands of data in some 500 tables, charts and maps. In the chapter devoted to earnings and incomes, it is a novelty compared to previous years that net earnings in which allowances and types of exemptions are accounted for, too, came into focus from 2019. In the number of employees, people working in working time shorter than 60 working hours per month are also taken into account. In addition, the theme of environment is completed with areas declared world heritage sites by UNESCO.

Hungary, 2024
Hungary’s GDP increased by 0.5% amid global challenges in 2024. The performance of goods-producing industries lessened, while that of service-providing ones rose, which shows the duality of economic trends. Household consumption picked up, which was considerably encouraged by the purchasing power of earnings growing again with the inflationary wave calming down. Besides, the data series reveal that the level of employment reached another peak.
Related themes
Methodological information
Release and revision calendarPublication repertory
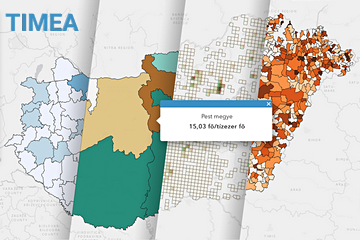
Data visualisations