Construction
Statistics of construction provides data for analysing production in construction (by groups of construction and divisions), its framework and regional variations of output. Construction of buildings and civil engineering works, their structurally complete and specialised construction belong here.
Key figures
Share of construction in gross added value
Indicator description
Share of the construction section in the gross added value of the national economy, at current base prices
Source of data:
Summary Tables (STADAT)
Last data for period: 2024
Construction output change in volume
Indicator description
Changes in output volume at enterprises included in construction compared to the same period of the previous year.
Source of data:
Summary Tables (STADAT)
Last data for period: March 2026
Change in volume of new orders in construction in the reference period
Indicator description
Changes in the volume of orders concluded in the reference period at enterprises included in construction compared to the same period of the previous year.
Source of data:
Summary Tables (STADAT)
Last data for period: March 2026
Change in volume of the stock of orders in construction at the end of the reference period
Indicator description
Changes in the volume of orders concluded, at the end of the reference period at enterprises included in construction compared to the same period of the previous year.
Source of data:
Summary Tables (STADAT)
Last data for period: March 2026
Featured
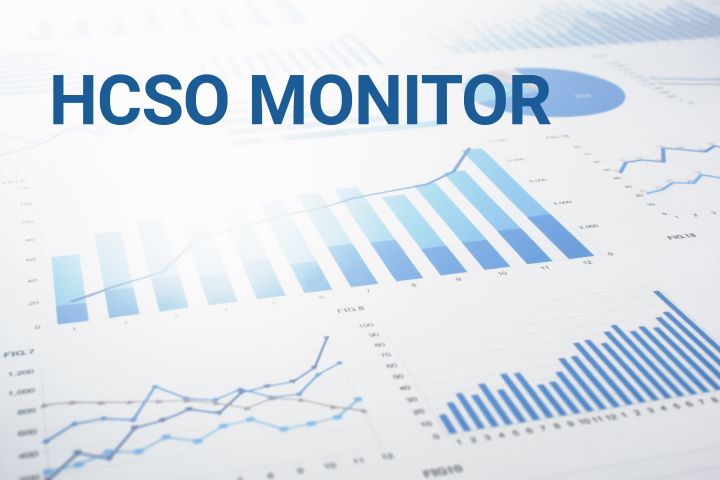
HCSO Monitor
The collection of interactive figures provides up-to-date information on the latest domestic and international socio-economic trends. The decisive part of the figures included in HCSO Monitor are downloadable in both image and data formats (PNG, SVG and CSV). Feel free to browse the data in HCSO Monitor, updated many times a week!

Construction output volume increased by 3.9% in March 2026 year-on-year and grew by 0.5% compared to the previous month; Construction, March 2026
Construction output volume, based on raw data, was 3.9% higher than a year earlier and grew by 2.0% based on working-day adjusted data. Among the main construction groups, the construction of buildings increased by 4.4%, while that of civil engineering rose by 3.0%. Based on seasonally and working-day adjusted indices, construction output was 0.5% above the February 2026 level. Construction producer prices increased by 4.7% in the 1st quarter of 2026 compared to the same period of the previous year.

Hungary 1st-3rd quarters of 2025 – Continuously increasing consumption
The performance of Hungary’s economy surpassed the previous year’s level by 0.3% in the 1st-3rd quarters of 2025. The increasing performance of the services sector and construction as well as growing consumption had a positive impact on GDP. These impacts however have been subdued by the setback of the industry and agriculture, the continuously subdued investment activity. Retail trade volume continued to rise, foreign demand at accommodation establishments increased, too.

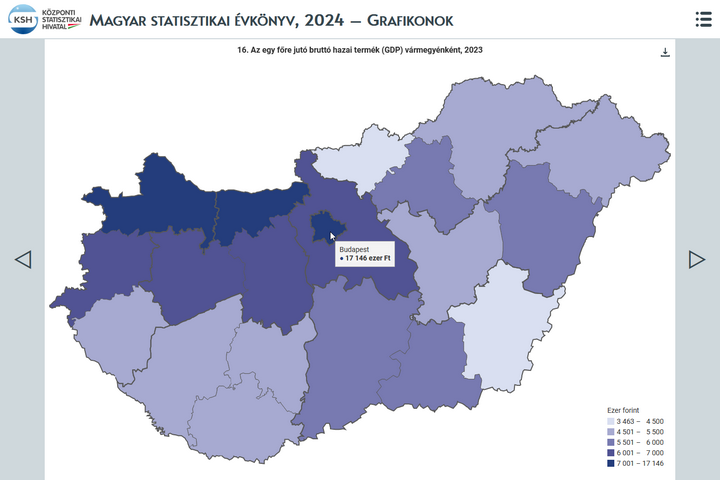
Statistical Yearbook of Hungary, 2024
The yearbook provides an overview of Hungary's demographic, social and economic trends, environmental characteristics and their changes over time, with the help of tens of thousands of data in some 500 tables, charts and maps. In the chapter devoted to earnings and incomes, it is a novelty compared to previous years that net earnings in which allowances and types of exemptions are accounted for, too, came into focus from 2019. In the number of employees, people working in working time shorter than 60 working hours per month are also taken into account. In addition, the theme of environment is completed with areas declared world heritage sites by UNESCO.

Hungary, 2024
Hungary’s GDP increased by 0.5% amid global challenges in 2024. The performance of goods-producing industries lessened, while that of service-providing ones rose, which shows the duality of economic trends. Household consumption picked up, which was considerably encouraged by the purchasing power of earnings growing again with the inflationary wave calming down. Besides, the data series reveal that the level of employment reached another peak.

Snapshots, 2023 – Construction
Construction output in 2023 – reaching HUF 7387 billion at current price - following a two-year long growth, lagged behind the one year earlier level by 5.0% at comparative price. The downturn in production was due to the 5.6% volume decrease in the construction of buildings and the 3.8% fallback in civil engineering works. The volumes of new contracts concluded in 2023 and that of end-of-year stock of contracts both lessened, the former by 11.2%, the latter by 23.5%.
Related themes
Methodological information
First releases |
Latest release | Next release |
|---|---|---|
| Construction, March 2026 | 13/05/2026 | 12/06/2026 |
Data visualisations