Environment, public utilities
Environmental statistics covers data on natural resources (e.g. mineral resources, water resources), the load of the environment (e.g. air pollution, sewage treatment, waste management), environmental quality (quality of e.g. air, water or soil), nature protection (e.g. protected areas, protected species) and environmental protection (e.g. environmental investments, environmental expenditures, environmental taxes). It shows the state and the load of the environment, and quantifies efforts against the load of the environment. Public utilities statistics covers statistical data on public utilities (electricity, gas, purchased heat, drinking water, sewage, waste) in settlements.
Key figures
Emissions of carbon dioxide
Indicator description
Emissions of carbon dioxide in a particular year (excluding carbon dioxide from biomass).
Source of data:
Summary Tables (STADAT)
Last data for period: 2023
Emissions of suspended dust with a diameter of less than 2.5 µm
Indicator description
Emissions of particulate matter with a diameter of less than 2.5 µm by anthropogenic (industrial, transport, agricultural and public utilities) sources.
Source of data:
Summary Tables (STADAT)
Last data for period: 2023
Annual water consumption per capita
Indicator description
The indicator shows the quantity of annual water consumption in cubic metres per inhabitant. Drinking and household water needs of the population can be satisfied and the supply of water of drinking water quality to enterprises, public institutions and smaller industrial plants can be ensured by own water works of plants or institutions, from private or common wells and from public water conduits.
Source of data:
Summary Tables (STADAT)
Last data for period: 2024
Proportion of forests that are healthy in terms of defoliation
Indicator description
Area of forests with a foliage density considered as ideal in a particular habitat, as a proportion of total forest area.
Source of data:
Summary Tables (STADAT)
Last data for period: 2024
Featured
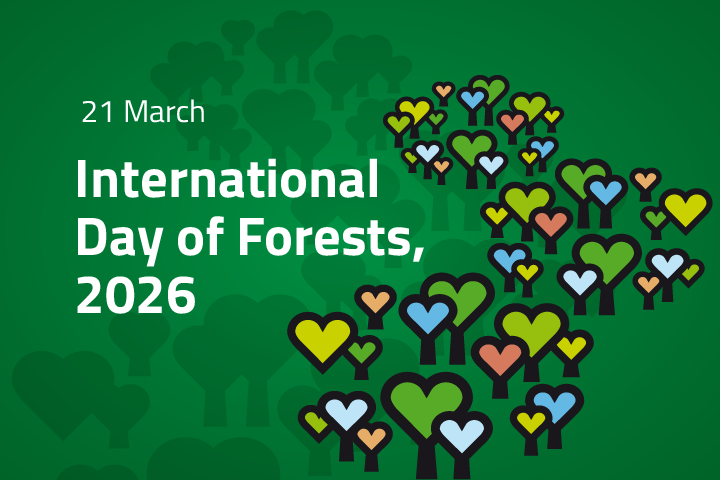
International Day of Forests
Since 2013, at the initiative of the United Nations, the International Day of Forests has been celebrated on 21 March, the first day of astronomical spring. The theme of the 2026 event is „Forest and economies”, highlighting roles that go beyond nature conservation, including energy and raw material production as well as the provision of jobs (and thus income). By the end of 2024, the forest area in Hungary had expanded to a century long record of 1.96 million hectares. Timber harvested from Hungarian forests was used in nearly equal proportions for industrial purposes and as firewood.
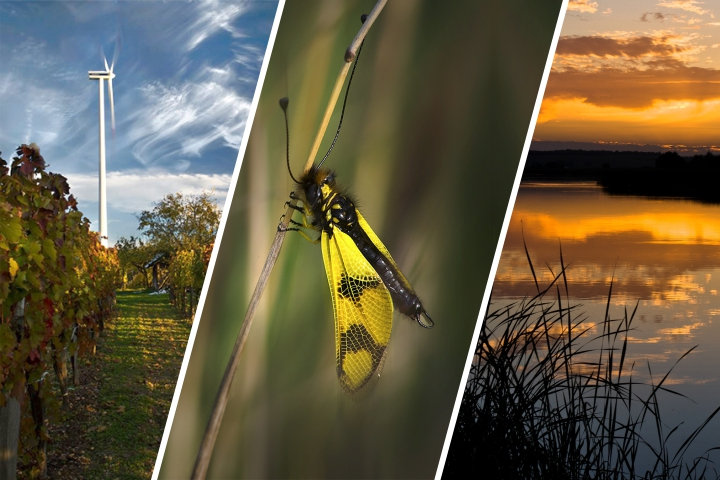
Snapshots, 2024 – Environment
In our publication Environmental Snapshot 2024, we present a comprehensive overview of the current state of our environment. Alongside indicators assessing the condition of water, soil, air, and biodiversity, we devote particular attention to energy management and waste management. We also highlight the ways in which agriculture, industry, and construction contribute to environmental change.
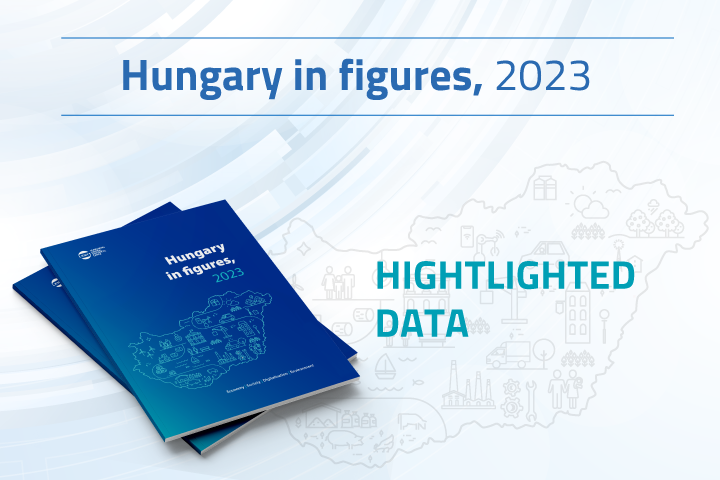
Hungary in figures, 2023 – Highlighted data
At the aid of our infographic made using the main data in our publication titled Hungary in figures, 2023, we give a comprehensive picture of the socio-economic state of Hungary. There were 1,073 females per thousand males in Hungary at the beginning of 2024. Life expectancy at birth rose to the highest level yet in 2023 (to 73.4 years for males and 79.6 years for females). Over a quarter of manufacturing output was made up by the manufacture of transport equipment.
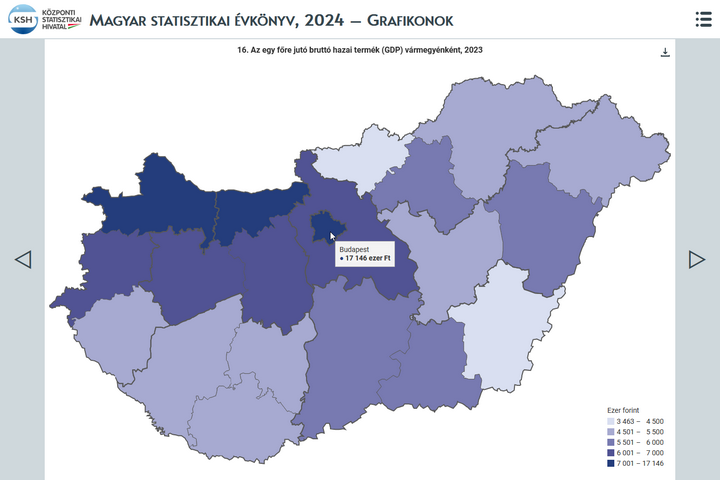
Statistical Yearbook of Hungary, 2024
The yearbook provides an overview of Hungary's demographic, social and economic trends, environmental characteristics and their changes over time, with the help of tens of thousands of data in some 500 tables, charts and maps. In the chapter devoted to earnings and incomes, it is a novelty compared to previous years that net earnings in which allowances and types of exemptions are accounted for, too, came into focus from 2019. In the number of employees, people working in working time shorter than 60 working hours per month are also taken into account. In addition, the theme of environment is completed with areas declared world heritage sites by UNESCO.
Hungary 2024 – The Environment and the Energy Management
Our series of infographics, based on the most important data from the Hungarian-language publication Hungary, 2024 provides a comprehensive picture of the social and economic state of our country and the main characteristics of our environment. The last infographic in the series presents the main data of the environment and energy management. The English extract from the publication is available here: Hungary, 2024, and the full Hungarian-language version here: Magyarország, 2024.

Hungary, 2024
Hungary’s GDP increased by 0.5% amid global challenges in 2024. The performance of goods-producing industries lessened, while that of service-providing ones rose, which shows the duality of economic trends. Household consumption picked up, which was considerably encouraged by the purchasing power of earnings growing again with the inflationary wave calming down. Besides, the data series reveal that the level of employment reached another peak.
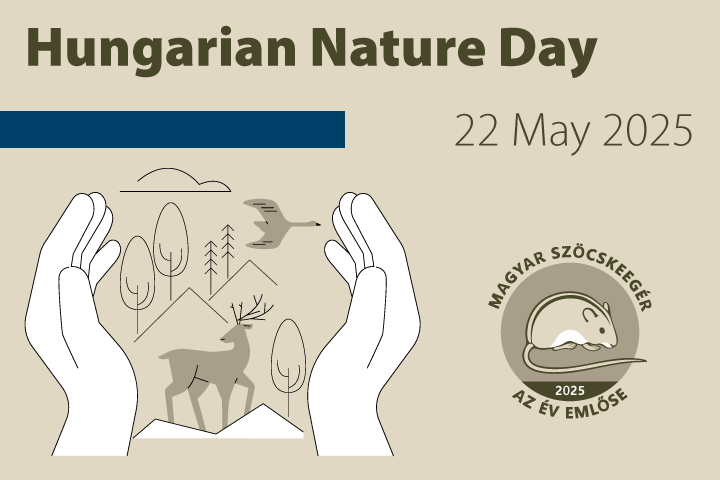
Hungarian Nature Day, 22 May
The Hungarian birch mouse became the Mammal of the Year in Hungary in 2025, and it is a specially protected global rarity with an intangible value of HUF 1,000,000 per individual. 186 of the 1,193 protected animal species belonged to the most endangered specially protected category in Hungary in 2024. Our infographic prepared for Hungarian Nature Day provides information on the Mammal of the Year as well as protected natural values in Hungary.
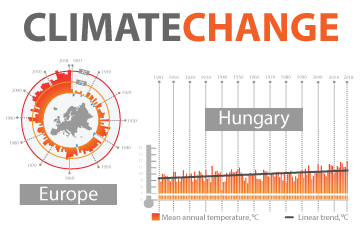
Snapshots, 2023 – Climate indicators in Hungary
The publication presents and quantifies climate change-related processes in Hungary based on a set of indicators that are consistent with domestic policies and international standards. Increasingly frequent extreme weather events, such as heat waves and supercells, affect energy use and damage wildlife, agricultural crops and infrastructure. Climate change threatens people's health and has a negative impact on the economic cycle.
Settlement related data regarding 2021 are presented here
Datasets from the Dissemination Database regarding settlements have been updated with 2021 data, as such settlement related data for 2021 are available since 13 December, concerning, among others, public water and sewerage.
Indicators of sustainable development for Hungary, 2018
In 1992, the United Nations Conference on Environment and Development was held in Rio de Janeiro, and gave the impetus to the integration of the concept of sustainable development into national and global policies. In Hungary, the National Sustainable Development Council (NFFT, established in 2007) developed the Hungarian National Sustainable Development Framework Strategy, which was adopted by the Parliament in 2013. The framework strategy aims to provide a nationwide, long-term guide for individual and community action. Compared to the strategy of the European Union or the UN SDGs, the Hungarian framework strategy interprets the concept of sustainability much more narrowly. In this interpretation, sustainable development policy is primarily a long-term resource management activity in which it distinguishes four resources: human, social, natural and economic resources.
Related themes
Methodological information
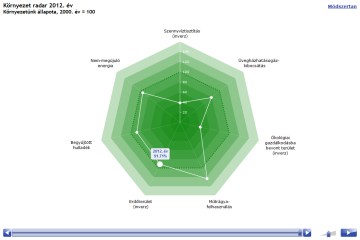
Data visualisations