Energy
The aim of energy management is to supply energy, vital to the society and the economy, to the different sectors of use. Energy management statistics include statistics on energy production and use, the energy balance, the security of supply, the energy market, energy trade, energy efficiency and renewable energy sources.
Key figures
Production of primary energy carriers
Indicator description
Volume of production of primary energy carriers (coal, petroleum, natural gas, by-products of petroleum and natural gas extraction, atomic energy, biogas, biomass, municipal and industrial waste, biofuel and solar, wind, hydro and geothermal energy), expressed in heat value (petajoules).
Source of data:
Summary Tables (STADAT)
Last data for period: 2024
Final energy use
Indicator description
Volume of energy actually used by consumers, expressed in petajoules.
Source of data:
Summary Tables (STADAT)
Last data for period: 2024
Share of electricity produced from renewable energy sources and waste
Indicator description
Renewables-based electricity production expressed in heat value (petajoules), as a share of energy production.
Source of data:
Summary Tables (STADAT)
Last data for period: 2024
Primary energy use
Indicator description
Use of primary energy carriers (coal, petroleum, natural gas, by-products of petroleum and natural gas extraction, atomic energy, biogas, biomass, municipal and industrial waste, biofuel and solar, wind, hydro and geothermal energy), expressed in heat value (petajoules).
Source of data:
Summary Tables (STADAT)
Last data for period: 2024
Featured

International Day of Forests
Since 2013, at the initiative of the United Nations, the International Day of Forests has been celebrated on 21 March, the first day of astronomical spring. The theme of the 2026 event is „Forest and economies”, highlighting roles that go beyond nature conservation, including energy and raw material production as well as the provision of jobs (and thus income). By the end of 2024, the forest area in Hungary had expanded to a century long record of 1.96 million hectares. Timber harvested from Hungarian forests was used in nearly equal proportions for industrial purposes and as firewood.
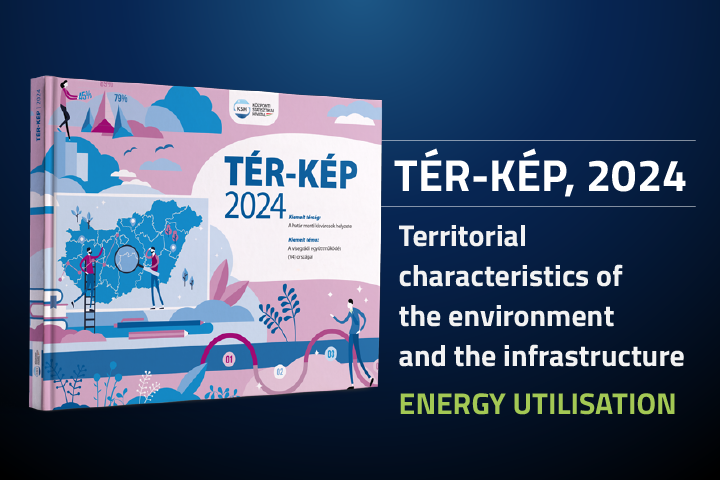
TÉR-KÉP, 2024 – Territorial characteristics of the environment and the infrastructure
The Territorial characteristics of the environment and the infrastructure chapter of the Map-Snap, 2024 publication presents, among others, the state of Hungary’s natural environment, the extent of the transport network, the growth of the vehicle fleet, changes in the most significant indicators of public utilities and that of energy management. The installation of heat pumps became in 2024 the most common primary heating method for new dwellings in Hungary, their proportion increasing to 50% (from 42% in 2023), while gas heating decreased to 33% (from 45% in the previous year). The complete publication is available in Hungarian at: TÉR-KÉP, 2024

Hungary 1st-3rd quarters of 2025 – Continuously increasing consumption
The performance of Hungary’s economy surpassed the previous year’s level by 0.3% in the 1st-3rd quarters of 2025. The increasing performance of the services sector and construction as well as growing consumption had a positive impact on GDP. These impacts however have been subdued by the setback of the industry and agriculture, the continuously subdued investment activity. Retail trade volume continued to rise, foreign demand at accommodation establishments increased, too.
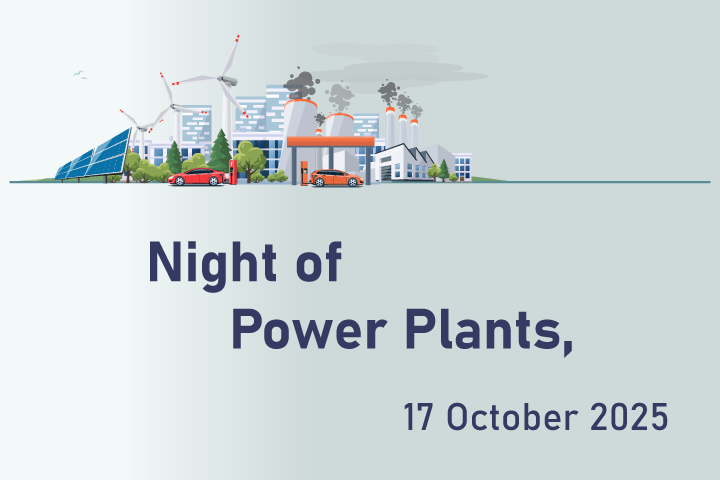
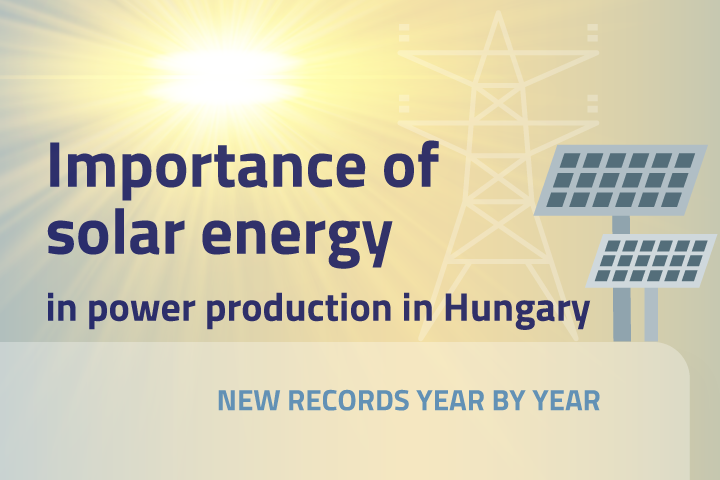
Night of Power Plants, 17 October 2025
The Hungarian Energy and Public Utility Regulatory Authority will hold the Night of Power Plants on 17 October this year. Interested people can have a look into the world of energy suppliers and public utility companies at more than 80 venues throughout the country. Fossil sources have continuously declined in importance in Hungary in the last decades, while renewables-based electricity production grew to a record level, 11.6 billion kilowatt hours in 2024. Solar energy in Hungary (9.0 billion kWh) has an outstanding role even at an international level, having ensured over three-quarters of green electricity last year.
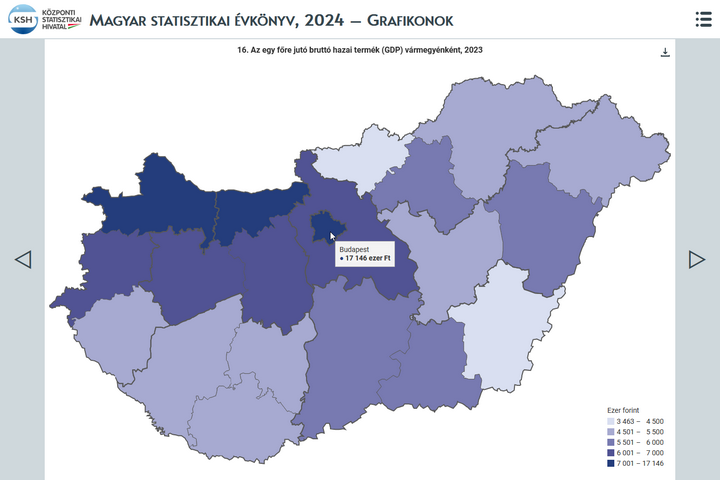
Statistical Yearbook of Hungary, 2024
The yearbook provides an overview of Hungary's demographic, social and economic trends, environmental characteristics and their changes over time, with the help of tens of thousands of data in some 500 tables, charts and maps. In the chapter devoted to earnings and incomes, it is a novelty compared to previous years that net earnings in which allowances and types of exemptions are accounted for, too, came into focus from 2019. In the number of employees, people working in working time shorter than 60 working hours per month are also taken into account. In addition, the theme of environment is completed with areas declared world heritage sites by UNESCO.

Hungary, 2024
Hungary’s GDP increased by 0.5% amid global challenges in 2024. The performance of goods-producing industries lessened, while that of service-providing ones rose, which shows the duality of economic trends. Household consumption picked up, which was considerably encouraged by the purchasing power of earnings growing again with the inflationary wave calming down. Besides, the data series reveal that the level of employment reached another peak.
Related themes
Methodological information
Dissemination database ( infra-annual data annual data ) |
Latest update | Next update |
|---|---|---|
Energy balances | ||
| Consolidated primary energy balance | 22/05/2026 | 23/06/2026 |
| Key indicators of Physical Energy Flow Accounts (PEFA) | 13/01/2026 | 30/10/2026 |
| Consolidated primary energy balance | 07/06/2023 | – |
Data visualisations