Internal trade
Trade is the resale of purchased goods without conversion, an activity that links production to consumption. Trade in goods contributes to the efficient functioning of the national economy, the efficient use of resources, and the return on investment. During buying and selling, the goods purchased from producers are stored, stocked and then sold to users. Statistics on internal trading establishments include the number of internal trading establishments operating in Hungary. Another area of internal trade statistics shows the following: domestic retail sales and volume changes in domestic retail sales.
Key figures
Share of trade and motor vehicle repair in gross value added
Indicator description
Internal trade and repair of motor vehicles as a share of gross value added at basic prices of the national economy in a given year, calculated at current prices.
Source of data:
Summary Tables (STADAT)
Last data for period: 2024
Number of retail stores
Indicator description
Number of retail units operated in Hungary either in a licensed form or after registration.
Source of data:
Summary Tables (STADAT)
Last data for period: 31.12.2025
Volume change in sales in retail stores
Indicator description
Volume change in retail store sales compared to the same period of the previous year, adjusted for working-day effects.
Source of data:
Summary Tables (STADAT)
Last data for period: April 2026
Changes in the volume of sales in specialized and non-specialized food shops
Indicator description
Changes in the volume of sales in specialized and non-specialized food shops compared to the same period of the previous year, adjusted for working-day effects.
Source of data:
Summary Tables (STADAT)
Last data for period: April 2026
Featured
HCSO Monitor
The collection of interactive figures provides up-to-date information on the latest domestic and international socio-economic trends. The decisive part of the figures included in HCSO Monitor are downloadable in both image and data formats (PNG, SVG and CSV). Feel free to browse the data in HCSO Monitor, updated many times a week!
Retail sales were 3.6% up on the same period last year and 1.2% down on the previous month; Retail trade, April 2026
In April 2026, the volume of retail trade was 1.7% higher according to raw data, or 3.6% higher in calendar (and Easter effects) adjusted terms, than in the same month of the previous year. Compared to the same period of the previous year, calendar-adjusted sale volumes expanded by 3.4% in specialized and non-specialized food shops, by 2.6% in non-food retailing and by 9.1% in automotive fuel retailing. According to seasonally and calendar adjusted data, the volume of retail sales was 1.2% down on the previous month. In January–April 2026, the volume of sales – also according to calendar adjusted data – was 4.8% higher than in the corresponding period of the previous year.
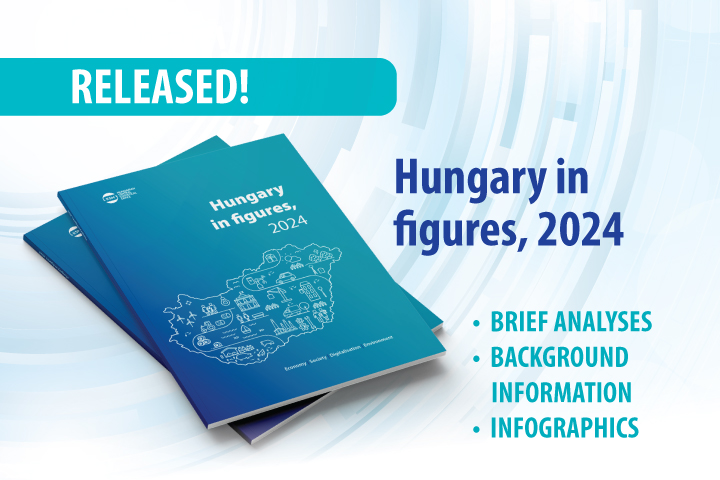
Hungary in figures, 2024
Hungary’s population on 1 January 2024 was 9 million 585 thousand people, with nearly 18% living in the capital city, almost 53% in towns, and 30% in villages. In 2023, Hungary’s trade surplus in goods reached its highest level since 2016 (9.0 billion euros), while the surplus in services also rose to a record high (11.0 billion euros). Both the production volume and average yield of the major arable crops increased; the production of barley reached an unprecedented level of 2.2 million tonnes.

Statistical Pocketbook of Hungary, 2025
The tables and charts in the latest edition of the Statistical Pocketbook of Hungary provide a comprehensive insight into the development of social and economic trends in Hungary during the year 2024. It aims to provide a summary picture of the country's situation in all possible areas based on preliminary indicators. In this year’s pocketbook, alongside the NACE Rev.2 classification, we also publish the number of business units according to the new NACE Rev.2.1 structure, as well as foreign trade data compiled under the new methodology.

Snapshots, 2025 – Retail trade
The calendar adjusted volume of domestic retail sales in 2025 exceeded the previous year’s level by 2.9%. Sales volumes rose by 2.5% in specialized and non-specialized food shops, by 4.1% in non food retailing, and by 1.0% in automotive fuel retailing. By the end of June 2025, the number of retail outlets was 2.6% lower – around 2,500 fewer – than a year earlier, while the average floorspace of shops increased by 3.9% over the same period.

Hungary 1st-3rd quarters of 2025 – Continuously increasing consumption
The performance of Hungary’s economy surpassed the previous year’s level by 0.3% in the 1st-3rd quarters of 2025. The increasing performance of the services sector and construction as well as growing consumption had a positive impact on GDP. These impacts however have been subdued by the setback of the industry and agriculture, the continuously subdued investment activity. Retail trade volume continued to rise, foreign demand at accommodation establishments increased, too.

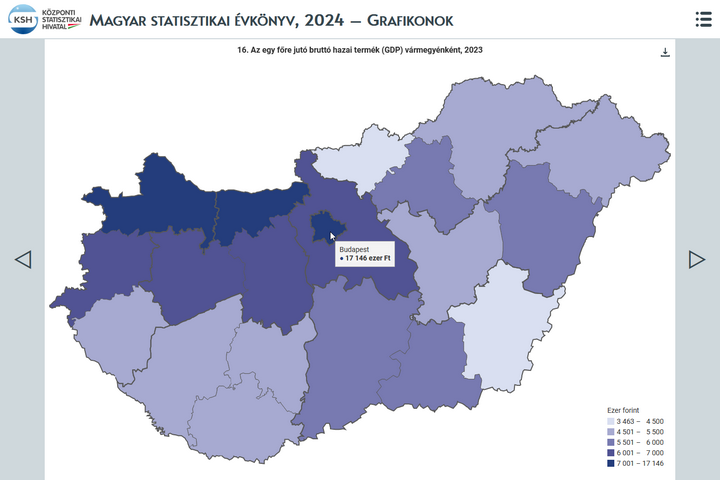
Statistical Yearbook of Hungary, 2024
The yearbook provides an overview of Hungary's demographic, social and economic trends, environmental characteristics and their changes over time, with the help of tens of thousands of data in some 500 tables, charts and maps. In the chapter devoted to earnings and incomes, it is a novelty compared to previous years that net earnings in which allowances and types of exemptions are accounted for, too, came into focus from 2019. In the number of employees, people working in working time shorter than 60 working hours per month are also taken into account. In addition, the theme of environment is completed with areas declared world heritage sites by UNESCO.
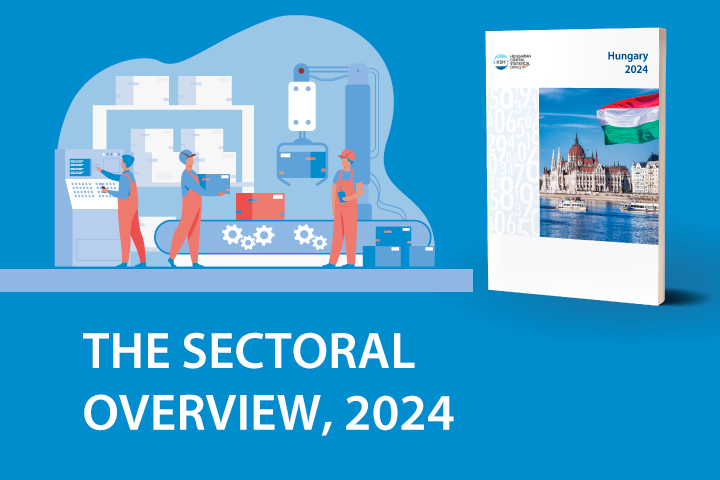
Hungary 2024 – The Sectoral Overview
Our series of infographics, based on the most important data from the Hungarian-language publication Hungary, 2024 provides a comprehensive picture of the social and economic state of our country and the main characteristics of our environment. The next infographic in the series presents the main data of the sectoral overview. The English extract from the publication is available here: Hungary, 2024, and the full Hungarian-language version here: Magyarország, 2024.

Hungary, 2024
Hungary’s GDP increased by 0.5% amid global challenges in 2024. The performance of goods-producing industries lessened, while that of service-providing ones rose, which shows the duality of economic trends. Household consumption picked up, which was considerably encouraged by the purchasing power of earnings growing again with the inflationary wave calming down. Besides, the data series reveal that the level of employment reached another peak.
Related themes
Methodological information
First releases |
Latest release | Next release |
|---|---|---|
| Retail trade, April 2026 | 04/06/2026 | 06/07/2026 |
Dissemination database ( infra-annual data annual data ) |
Latest update | Next update |
|---|---|---|
Distributive internal trade units | ||
| Internal trade units | 15/05/2026 | 13/11/2026 |
| Internal trade units | 16/12/2016 | – |
| Internal trade units | 09/09/2016 | – |
| Internal trade units | 09/09/2016 | – |
| Internal trade units | 09/09/2016 | – |
Retail trade turnover by groups of shops | ||
| Sales of retail shops by type of shop (2021 = 100.0) | 04/06/2026 | – |
| Sales of retail shops by type of shop (2015 = 100.0) | 06/02/2024 | 09/01/2026 |
| Sales of retail shops by type of shop (2015=100.0) - second estimate | 05/12/2019 | – |
| Sales of retail shops by type of shop (2015=100.0) - first estimate | 05/02/2019 | – |
| Sales of retail shops by type of shop (2010=100.0) - second estimate | 22/02/2018 | – |
| Sales of retail shops by type of shop (2010=100.0) - first estimate | 05/02/2018 | – |
| Sales of retail shops by type of shop | 25/02/2013 | – |
| Sales of retail shops by type of shop | 03/07/2009 | – |
Data visualisations