Transport
Transport statistics is about performances related to forwarding goods and the spatial movement of persons. Statistics on the movement of people have two main areas: interurban passenger transport (public transport between two settlements) and local passenger transport (public transport within a settlement). It also monitors the transport infrastructure involving rolling stock (e.g. number of passenger cars, buses) and built infrastructure (e.g. length of motorways, railway lines). Accident statistics take into account accidents in the country, with a special focus on road traffic accidents causing personal injury.
Key figures
Share of transport and storage in gross value added
Indicator description
Share of transport and storage in the gross value added of the national economy at current basic prices.
Source of data:
Summary Tables (STADAT)
Last data for period: 2024
Change in freight performance
Indicator description
Change in freight performance measured by freight tonne kilometres compared to the same period last year.
Source of data:
Summary Tables (STADAT)
Last data for period: Q1 2026
Change in passenger transport performance
Indicator description
Changes in passenger transport performance measured by passenger kilometres compared to the same period last year.
Source of data:
Summary Tables (STADAT)
Last data for period: Q1 2026
Number of passenger cars registered for the first time in Hungary
Indicator description
Number of passenger cars registered for the first time in Hungary.
Source of data:
Summary Tables (STADAT)
Last data for period: Q1 2026
Featured
HCSO Monitor
The collection of interactive figures provides up-to-date information on the latest domestic and international socio-economic trends. The decisive part of the figures included in HCSO Monitor are downloadable in both image and data formats (PNG, SVG and CSV). Feel free to browse the data in HCSO Monitor, updated many times a week!
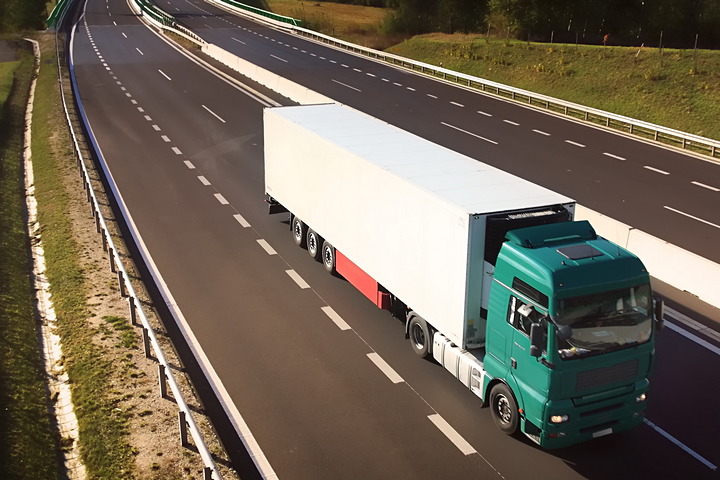
Snapshots, 2024 - Transport
In 2024, the performance of freight transport and urban passenger transport in Hungary increased slightly, while that of interurban passenger transport grew significantly compared with the previous year. At the same time, the performance of the first two branches – particularly freight transport – still fell short of the pre-pandemic level recorded in 2019. The number of newly registered passenger cars exceeded the previous year’s figure by 9.0%, yet remained about one quarter below the peak reached in 2019.

Statistical Yearbook of Hungary, 2024
The yearbook provides an overview of Hungary's demographic, social and economic trends, environmental characteristics and their changes over time, with the help of tens of thousands of data in some 500 tables, charts and maps. In the chapter devoted to earnings and incomes, it is a novelty compared to previous years that net earnings in which allowances and types of exemptions are accounted for, too, came into focus from 2019. In the number of employees, people working in working time shorter than 60 working hours per month are also taken into account. In addition, the theme of environment is completed with areas declared world heritage sites by UNESCO.

Hungary, 2024
Hungary’s GDP increased by 0.5% amid global challenges in 2024. The performance of goods-producing industries lessened, while that of service-providing ones rose, which shows the duality of economic trends. Household consumption picked up, which was considerably encouraged by the purchasing power of earnings growing again with the inflationary wave calming down. Besides, the data series reveal that the level of employment reached another peak.
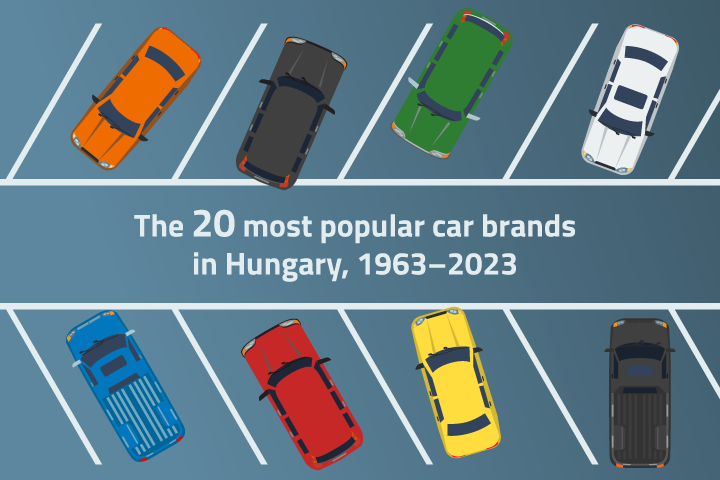
The 20 most popular car brands in Hungary, 1963-2023
In 60 years, the number of passenger cars increased in Hungary 60-fold, (from 70 thousand to 4.2 million). Half of the early 1960s cars were Škoda, Moskvitch, or Trabant, by adding Lada and Wartburg, too, these five brands were present mostly on the roads of Hungary; Polski Fiat and Dacia joined the group in the 1980s. Since 1975 Lada was sold in the largest numbers; following the regime change, however, Western European (with Opel in the forefront) then Far Eastern passenger cars gradually replaced the late Comecon brands.
Related themes
Methodological information
Release and revision calendarPublication repertory
Data visualisations