External trade and balance of payments
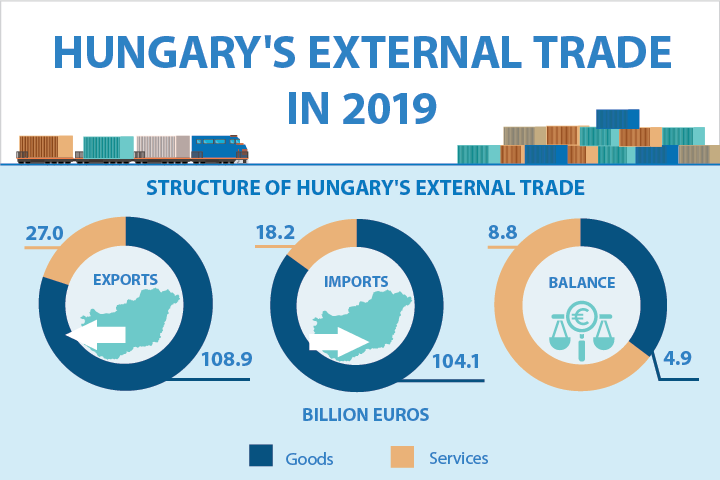
External trade statistics are made up of two main areas. Goods trade statistics collect data on the movement of physically existing goods among countries, while external services trade statistics take account of international trade in typically intangible services (e.g. travel, transport). Although services account for the larger part of production, some four-fifths of external trade is in goods. The difference is due to the differing degrees of storability and transportability. The balance of payments is a statistical statement that systematises the economic transactions of a particular country with the rest of the world in a particular period.
Key figures
Balance of external trade in goods
Indicator description
Difference between the value of goods exports and of goods imports in a particular month or in the months of the year processed to date in total, expressed in million\_euros. If the value of exports exceeds that of imports, then an external trade surplus, in the contrary case an external trade deficit is generated.
Source of data:
Summary Tables (STADAT)
Last data for period: December 2025
Change in volume of goods exports
Indicator description
Change in the quantity of goods exports compared to the same period of the previous year. Volume data eliminate the effects of price and exchange rate changes. The volume data here are not calendar adjusted.
Source of data:
Summary Tables (STADAT)
Last data for period: December 2025
Change in volume of goods imports
Indicator description
Change in the quantity of goods imports compared to the same period of the previous year. Volume data eliminate the effects of price and exchange rate changes. The volume data here are not calendar adjusted.
Source of data:
Summary Tables (STADAT)
Last data for period: December 2025
Balance of external trade in services
Indicator description
Difference between the value of services exports and of services imports in a particular quarter or in the quarters of the year processed to date in total. If the value of exports exceeds that of imports, then an external services trade surplus, in the contrary case an external services trade deficit is generated.
Source of data:
Summary Tables (STADAT)
Last data for period: Q3 2025
Featured
HCSO Monitor
The collection of interactive figures provides up-to-date information on the latest domestic and international socio-economic trends. The decisive part of the figures included in HCSO Monitor are downloadable in both image and data formats (PNG, SVG and CSV). Feel free to browse the data in HCSO Monitor, updated many times a week!
The surplus of the external trade in goods was EUR 333 million in December compared to the same period of the previous year, the volume of export improved by 3.8%, that of import grew by 7.9%; External trade in goods, December 2025
The surplus was EUR 333 million, the balance decreased by EUR 28 million, year-on-year. The volume of export increased by 3.8% compared to the same period of the previous year, that of import grew by 7.9%. The seasonally and working-day adjusted volume of export increased by 1.3% compared to November 2025, that of import decreased by 6.1%.
Hungary 1st-3rd quarters of 2025 – Continuously increasing consumption
The performance of Hungary’s economy surpassed the previous year’s level by 0.3% in the 1st-3rd quarters of 2025. The increasing performance of the services sector and construction as well as growing consumption had a positive impact on GDP. These impacts however have been subdued by the setback of the industry and agriculture, the continuously subdued investment activity. Retail trade volume continued to rise, foreign demand at accommodation establishments increased, too.
Snapshots, 2024 – World Trade
World trade regarding goods and services, following the 2% setback of 2023, grew in 2024 by 4%, to 32 thousand billion USD. External trade in goods increased by 2%, while that in services continued to grow even more strongly, by 10%, surpassing the increase registered in 2023. The share of services in global trade reached 27%, the largest proportion since 2005.
The surplus of the external trade in services in the 3rd quarter was EUR 3.9 billion; External trade in services, 3rd quarter 2025
Service exports calculated in EUR increased by 1.4%, imports lessened by 4.1% in the 3rd quarter of 2025, compared to the same period of the previous year. The surplus reached EUR 3.9 billion, EUR 415 million higher than in the 3rd quarter of 2024. The export value improved by 14%, that of import by 7.8%, generating an EUR 812 million higher surplus compared to the previous quarter.
Statistical Yearbook of Hungary, 2024
The yearbook provides an overview of Hungary's demographic, social and economic trends, environmental characteristics and their changes over time, with the help of tens of thousands of data in some 500 tables, charts and maps. In the chapter devoted to earnings and incomes, it is a novelty compared to previous years that net earnings in which allowances and types of exemptions are accounted for, too, came into focus from 2019. In the number of employees, people working in working time shorter than 60 working hours per month are also taken into account. In addition, the theme of environment is completed with areas declared world heritage sites by UNESCO.
Snapshots, 2024 - External trade
The volume of Hungary’s export of goods lessened in 2024 by 2.1%, its import by 3.7%. At the same time the balance of the external trade of goods improved by 1.2 thousand billion HUF, showing a surplus of 4.6 thousand billion HUF. The value of the export in services grew by 6.8%, that of its import by 5.3%, generating a 4.4 thousand billion HUF surplus, 404 billion more than in 2023.
Statistical Pocketbook of Hungary, 2024
The tables and charts in the latest edition of the Statistical Pocketbook of Hungary provide a comprehensive insight into the development of social and economic trends in Hungary during the year 2024. It aims to provide a summary picture of the country's situation in all possible areas based on preliminary indicators. Within the number of employees, this year's pocketbook also includes employed persons working less than 60 hours, and the gross revenues at tourist accommodation establishments.
Related themes
Methodological information
Related links
First releases |
Latest release | Next release |
|---|---|---|
| External trade in goods, December 2024 (first estimate) | 03/02/2025 | – |
| External trade in goods, December 2025 | 29/01/2026 | 02/03/2026 |
| External trade in services, 3rd quarter of 2025 | 01/12/2025 | 04/03/2026 |
Release and revision calendarPublication repertory
