International data
In order to assess Hungary’s role, share and position in the world and in the EU, it is essential to have comparable and reliable data on other countries. It may be difficult for users to find the appropriate data sources, routinely use international databases, reconcile data from different sources as well as identify and assess the reasons for any methodological differences. In order to make it easier, we have collected on this page our international publications and tables as well as links to major international databases, publication repertories, methodological collections.
Key figures
World population
Indicator description
UN demographers have prepared their estimate on the changes in world population in three (low, medium and high) scenarios. The data published here are based on the medium model, which is considered the most probable one, after the review in 2024.
Source of data:
United Nations, World Population Prospects 2024
Reference period: 2025 (further data shown on chart)
Change in volume of world GDP
Indicator description
The world’s GDP is an indicator comprising a wide range of products produced and services provided in countries on Earth in a particular period, so it measures the total output of these. The change in the volume of GDP is a generally accepted business indicator, which measures the change in the performance of the economy over time.
Source of data:
International Monetary Fund (IMF)
Last data for period: 2025
Change in volume of world exports
Indicator description
The indicator shows the change in the volume – i.e. the quantity net of changes in prices and exchange rates – of world exports from one year to another.
Source of data:
database of the World Trade Organization (WTO)
Last data for period: 2025
Changes in global tourism turnover
Indicator description
The indicator shows how the number of tourists in a given year has changed worldwide compared to the previous year. A tourist is a visitor who spends at least one night on a trip to the given area.
Source of data:
World Tourism Organization (UNWTO)
Last data for period: 2025
Featured
HCSO Monitor
The collection of interactive figures provides up-to-date information on the latest domestic and international socio-economic trends. The decisive part of the figures included in HCSO Monitor are downloadable in both image and data formats (PNG, SVG and CSV). Feel free to browse the data in HCSO Monitor, updated many times a week!
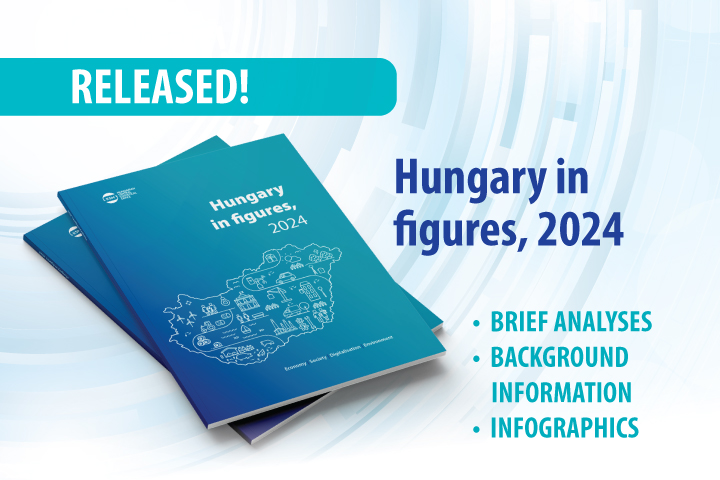
Hungary in figures, 2024
Hungary’s population on 1 January 2024 was 9 million 585 thousand people, with nearly 18% living in the capital city, almost 53% in towns, and 30% in villages. In 2023, Hungary’s trade surplus in goods reached its highest level since 2016 (9.0 billion euros), while the surplus in services also rose to a record high (11.0 billion euros). Both the production volume and average yield of the major arable crops increased; the production of barley reached an unprecedented level of 2.2 million tonnes.
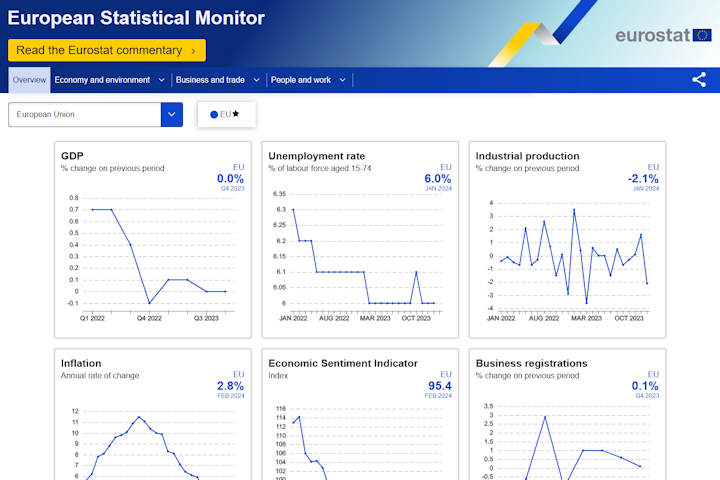
European Statistical Monitor: May edition
The chart collection contains monthly and quarterly indicators of economic and social developments by country and over time. The monthly updated chart collection with the latest available data for each indicator is available here.
Hungary joined the OECD 30 years ago
Hungary became a member of the Organisation for Economic Co?operation and Development (OECD) 30 years ago, on 7 May 1996. The Organisation currently has 38 member countries, including Hungary. In 2024, OECD countries accounted for 17% of the world’s population and 43% of global GDP. Hungary’s GDP per capita at purchasing power parity stood at 77.4% of the OECD average in 2025, an increase of 32.6 percentage points compared with 1996.
TÉR-KÉP, 2024 – Countries of the Visegrad Cooperation (V4)
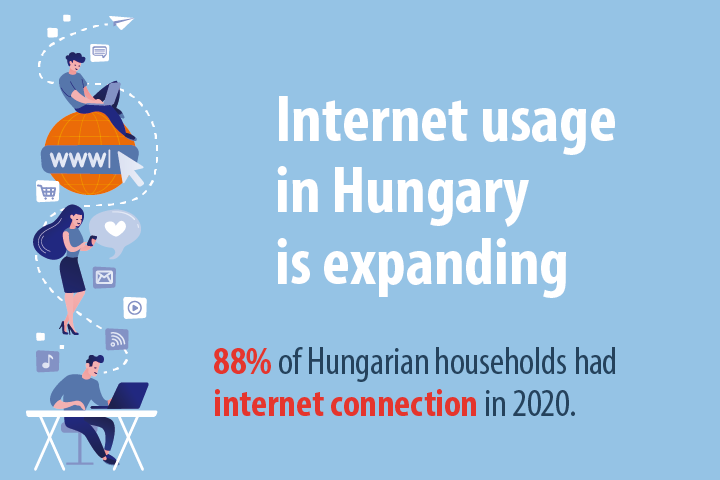
If the Visegrad Four (V4) would be considered as one single country, it would be the third most populous state and the fifth largest economy within the EU. Hungary registered the highest median age among the four countries, at the same time the proportion of those using the internet was on average the highest in our country. The economic activity indices of the V4 countries were more favourable than the EU average. The complete publication is available in Hungarian at: TÉR-KÉP, 2024
V4 – COMPETITIVE VISEGRAD – Main indicators of the Visegrad cooperation
The statistical offices of the Visegrad countries issue a joint publication each year, using data to explore the themes defined by the current V4 Presidency. Our publication, prepared in connection with the Hungarian V4 Presidency launched in July 2025, focuses on the areas of competitiveness, security, and connectivity. By thematic sections, it presents the position of the Visegrad Co-operation (V4) member states within the European Union, while also seeking to illustrate the collective weight of the V4 in the Union, thereby assessing the group’s economic competitiveness.
Statistical Yearbook of Hungary, 2024
The yearbook provides an overview of Hungary's demographic, social and economic trends, environmental characteristics and their changes over time, with the help of tens of thousands of data in some 500 tables, charts and maps. In the chapter devoted to earnings and incomes, it is a novelty compared to previous years that net earnings in which allowances and types of exemptions are accounted for, too, came into focus from 2019. In the number of employees, people working in working time shorter than 60 working hours per month are also taken into account. In addition, the theme of environment is completed with areas declared world heritage sites by UNESCO.
Word Population Day – 11 July
In 1989, the United Nations declared 11 July as World Population Day to raise awareness of the scale of population growth and the implied challenges. Today, the most significant population explosion is taking place in Africa, where the population increased 6.7-fold between 1950 and 2024; currently, 18% of the world’s population lives there. The United Nations predicts that by 2100, Africa will account for 37% of the world's population, while Asia's share is expected to decline from the current 59% to 45%.

Hungary, 2024
Hungary’s GDP increased by 0.5% amid global challenges in 2024. The performance of goods-producing industries lessened, while that of service-providing ones rose, which shows the duality of economic trends. Household consumption picked up, which was considerably encouraged by the purchasing power of earnings growing again with the inflationary wave calming down. Besides, the data series reveal that the level of employment reached another peak.
Key indicators for the Visegrad Cooperation countries
The circumstances caused by the Covid19 pandemic also had a negative impact on the socio-economic development of the V4 countries. This publication examines the return of the economy and society to pre-pandemic levels in the V4 countries and the EU, based on the Eurostat Recovery Dashboard indicators, bearing in mind the priorities (stability, reopening, partnership) set out in the current programme of the Hungarian Presidency of the Visegrad Cooperation (Recharging Europe).
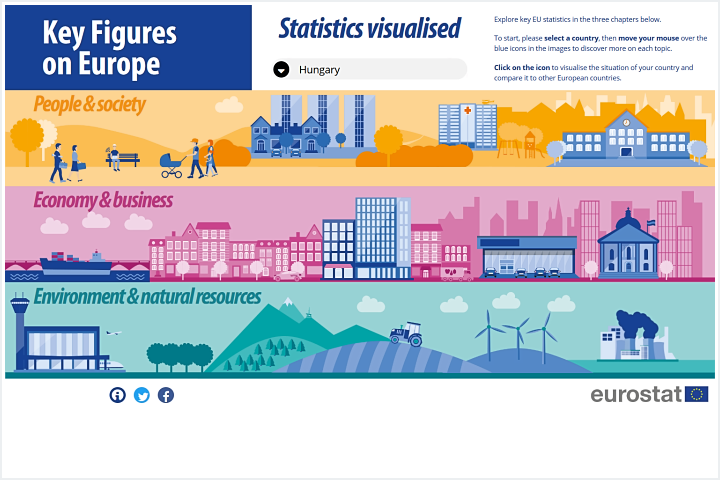
Key Figures on Europe
The digital publication of Eurostat allows a quick and interactive overview of the status of countries and offers the possibility of their comparison with other European countries. The different visualisation tools offer a playful way to look into selected statistics focusing on population, living conditions, health, working life, income and expenditure and social life.
Related themes
Methodological information
Related links
- CentropeMAP
- UN Database Update calendar
- EUROSTAT Dissemination Calendar
- National Statistical Offices
- OECD database
- IMF World Economic Outlook Reports
- IMF World Economic Outlook Databases
- Publications Office of the European Union
- OECD ILibrary
- Eurostat metadata
- OECD datavisualizations
- UN datavisualizations
- Eurostat datavisualizations
Release and revision calendarPublication repertory
Data visualisations