Prices
The development of prices influences the quantity of production and consumption, and their structure as well. Price statistics typically observe the temporal change in the price of goods put on the market, though there are spatial price indices (e.g. purchasing power parity), too. The consumer price index quantifies changes in consumer prices, differently, producer price indices observe price changes from the point of view of producers. There are also cost-based price indices (e.g. of agriculture, labour force), which show the development of production costs over time. External trade price indices provide information on the price development of goods exports and imports.
Key figures
Change in consumer prices
Indicator description
Average change in the prices of goods and services purchased by households for own use, compared to the same period of the previous year. The consumer price index less 100 equals the change in consumer prices.
Source of data:
Summary Tables (STADAT)
Last data for period: May 2026
Change in industrial producer prices
Indicator description
Average change in the producer prices of products produced by industrial producers and of the related provided services, compared to the same period of the previous year. The prices are basic prices, not including turnover tax, consumption tax and excise duty.
Source of data:
Summary Tables (STADAT)
Last data for period: April 2026
Changes in construction producer prices
Indicator description
Average change in the prices of construction activities performed in construction, compared to the same period of the previous year.
Source of data:
Summary Tables (STADAT)
Last data for period: Q1 2026
Terms of external trade in goods
Indicator description
The price index of goods exports divided by the price index of goods imports, multiplied by one hundred. If the value of the indicator is larger than 100, then the terms of trade improved, i.e. more import goods could be purchased for a unit of export goods (or less exports than earlier on had to be provided for a unit of imports). They show the change compared to the same period of the previous year.
Source of data:
Summary Tables (STADAT)
Last data for period: 2025
Featured
HCSO Monitor
The collection of interactive figures provides up-to-date information on the latest domestic and international socio-economic trends. The decisive part of the figures included in HCSO Monitor are downloadable in both image and data formats (PNG, SVG and CSV). Feel free to browse the data in HCSO Monitor, updated many times a week!
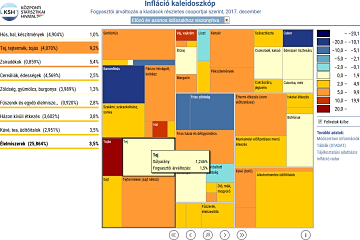
Consumer prices 1.8% higher on average than in same month of previous year; Consumer prices, May 2026
Consumer prices were 1.8% higher on average in May 2026 than a year earlier. Prices remained unchanged on average compared to April.

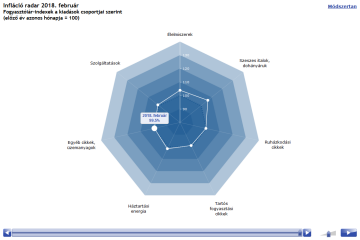
Industrial producer prices 0.3% higher on average in April 2026 than a year earlier but 1.3% lower compared to previous month; Industrial producer prices, April 2026
Industrial producer prices were 0.3% higher on average in April 2026 than in the same period of the previous year. Domestic output prices increased by 2.2%, while non-domestic output prices lessened by 0.5% compared to April 2025. Compared to the previous month, domestic output prices remained unchanged, while non-domestic output prices were 1.9% lower, so industrial producer prices as a whole were cut by 1.3%.

Statistical Pocketbook of Hungary, 2025
The tables and charts in the latest edition of the Statistical Pocketbook of Hungary provide a comprehensive insight into the development of social and economic trends in Hungary during the year 2024. It aims to provide a summary picture of the country's situation in all possible areas based on preliminary indicators. In this year’s pocketbook, alongside the NACE Rev.2 classification, we also publish the number of business units according to the new NACE Rev.2.1 structure, as well as foreign trade data compiled under the new methodology.

Day of Bees, 30 April
Since 2018, the United Nations has designated 20 May as World Bee Day to highlight the importance of beekeeping and the long standing, ever evolving relationship between humans and bees. The date is no coincidence: it marks the birthday of Anton Janša, a pioneer of modern apiculture. In Hungary, the Day of the Bees has been observed on 30 April since 1994 at the initiative of the National Hungarian Beekeeping Association, as this is the time when life in the hive begins to intensify. Bees are valuable not only for honey production; their pollination activity significantly influences the success of fruit cultivation.

Snapshot, 2025 – Consumer prices
Consumer prices were up by 4.4% on average in 2025, so the rate of inflation exceeded the previous year’s 3.7% level. It was the growth in service prices that drove the price rise the most, and the increase in food prices also had a substantial part. The rise in the consumer price index affected all product groups.

Hungary 1st-3rd quarters of 2025 – Continuously increasing consumption
The performance of Hungary’s economy surpassed the previous year’s level by 0.3% in the 1st-3rd quarters of 2025. The increasing performance of the services sector and construction as well as growing consumption had a positive impact on GDP. These impacts however have been subdued by the setback of the industry and agriculture, the continuously subdued investment activity. Retail trade volume continued to rise, foreign demand at accommodation establishments increased, too.

Statistical Yearbook of Hungary, 2024
The yearbook provides an overview of Hungary's demographic, social and economic trends, environmental characteristics and their changes over time, with the help of tens of thousands of data in some 500 tables, charts and maps. In the chapter devoted to earnings and incomes, it is a novelty compared to previous years that net earnings in which allowances and types of exemptions are accounted for, too, came into focus from 2019. In the number of employees, people working in working time shorter than 60 working hours per month are also taken into account. In addition, the theme of environment is completed with areas declared world heritage sites by UNESCO.

Snapshots, 2024 - Prices
Consumer prices were up by 3.7% on average in 2024 compared to the previous year, and the rate of price rise significantly decreased compared to the 2023 figure (17.6%), being a 25-year peak. The deceleration in inflation was influenced by the rate of increase in industrial, construction and services prices going on lessening, and agricultural product prices going down again on average. External trade prices expressed in forints slightly rose, and minor deterioration occurred in terms of trade.

Hungary, 2024
Hungary’s GDP increased by 0.5% amid global challenges in 2024. The performance of goods-producing industries lessened, while that of service-providing ones rose, which shows the duality of economic trends. Household consumption picked up, which was considerably encouraged by the purchasing power of earnings growing again with the inflationary wave calming down. Besides, the data series reveal that the level of employment reached another peak.
Related themes
- Agriculture
- Construction
- Culture, sports
- External trade and balance of payments
- Housing
- Industry
- International data
- Tourism, catering
Methodological information
First releases |
Latest release | Next release |
|---|---|---|
| Consumer prices, May 2026 | 09/06/2026 | 07/07/2026 |
| Industrial producer prices, April 2026 | 29/05/2026 | 30/06/2026 |
Release and revision calendarPublication repertory
Data visualisations