
In Q3 2023 compared to previous year
- employment continued to expand, mainly due to a recovery in the primary labour market and an increase in employment abroad;
- the number of unemployed and the unemployment rate also increased;
- the size of the potentially available labour force increased slightly;
- demand for additional labour has fallen;
- the purchasing power of earnings has fallen due to high inflation.
Number of persons employed has increased
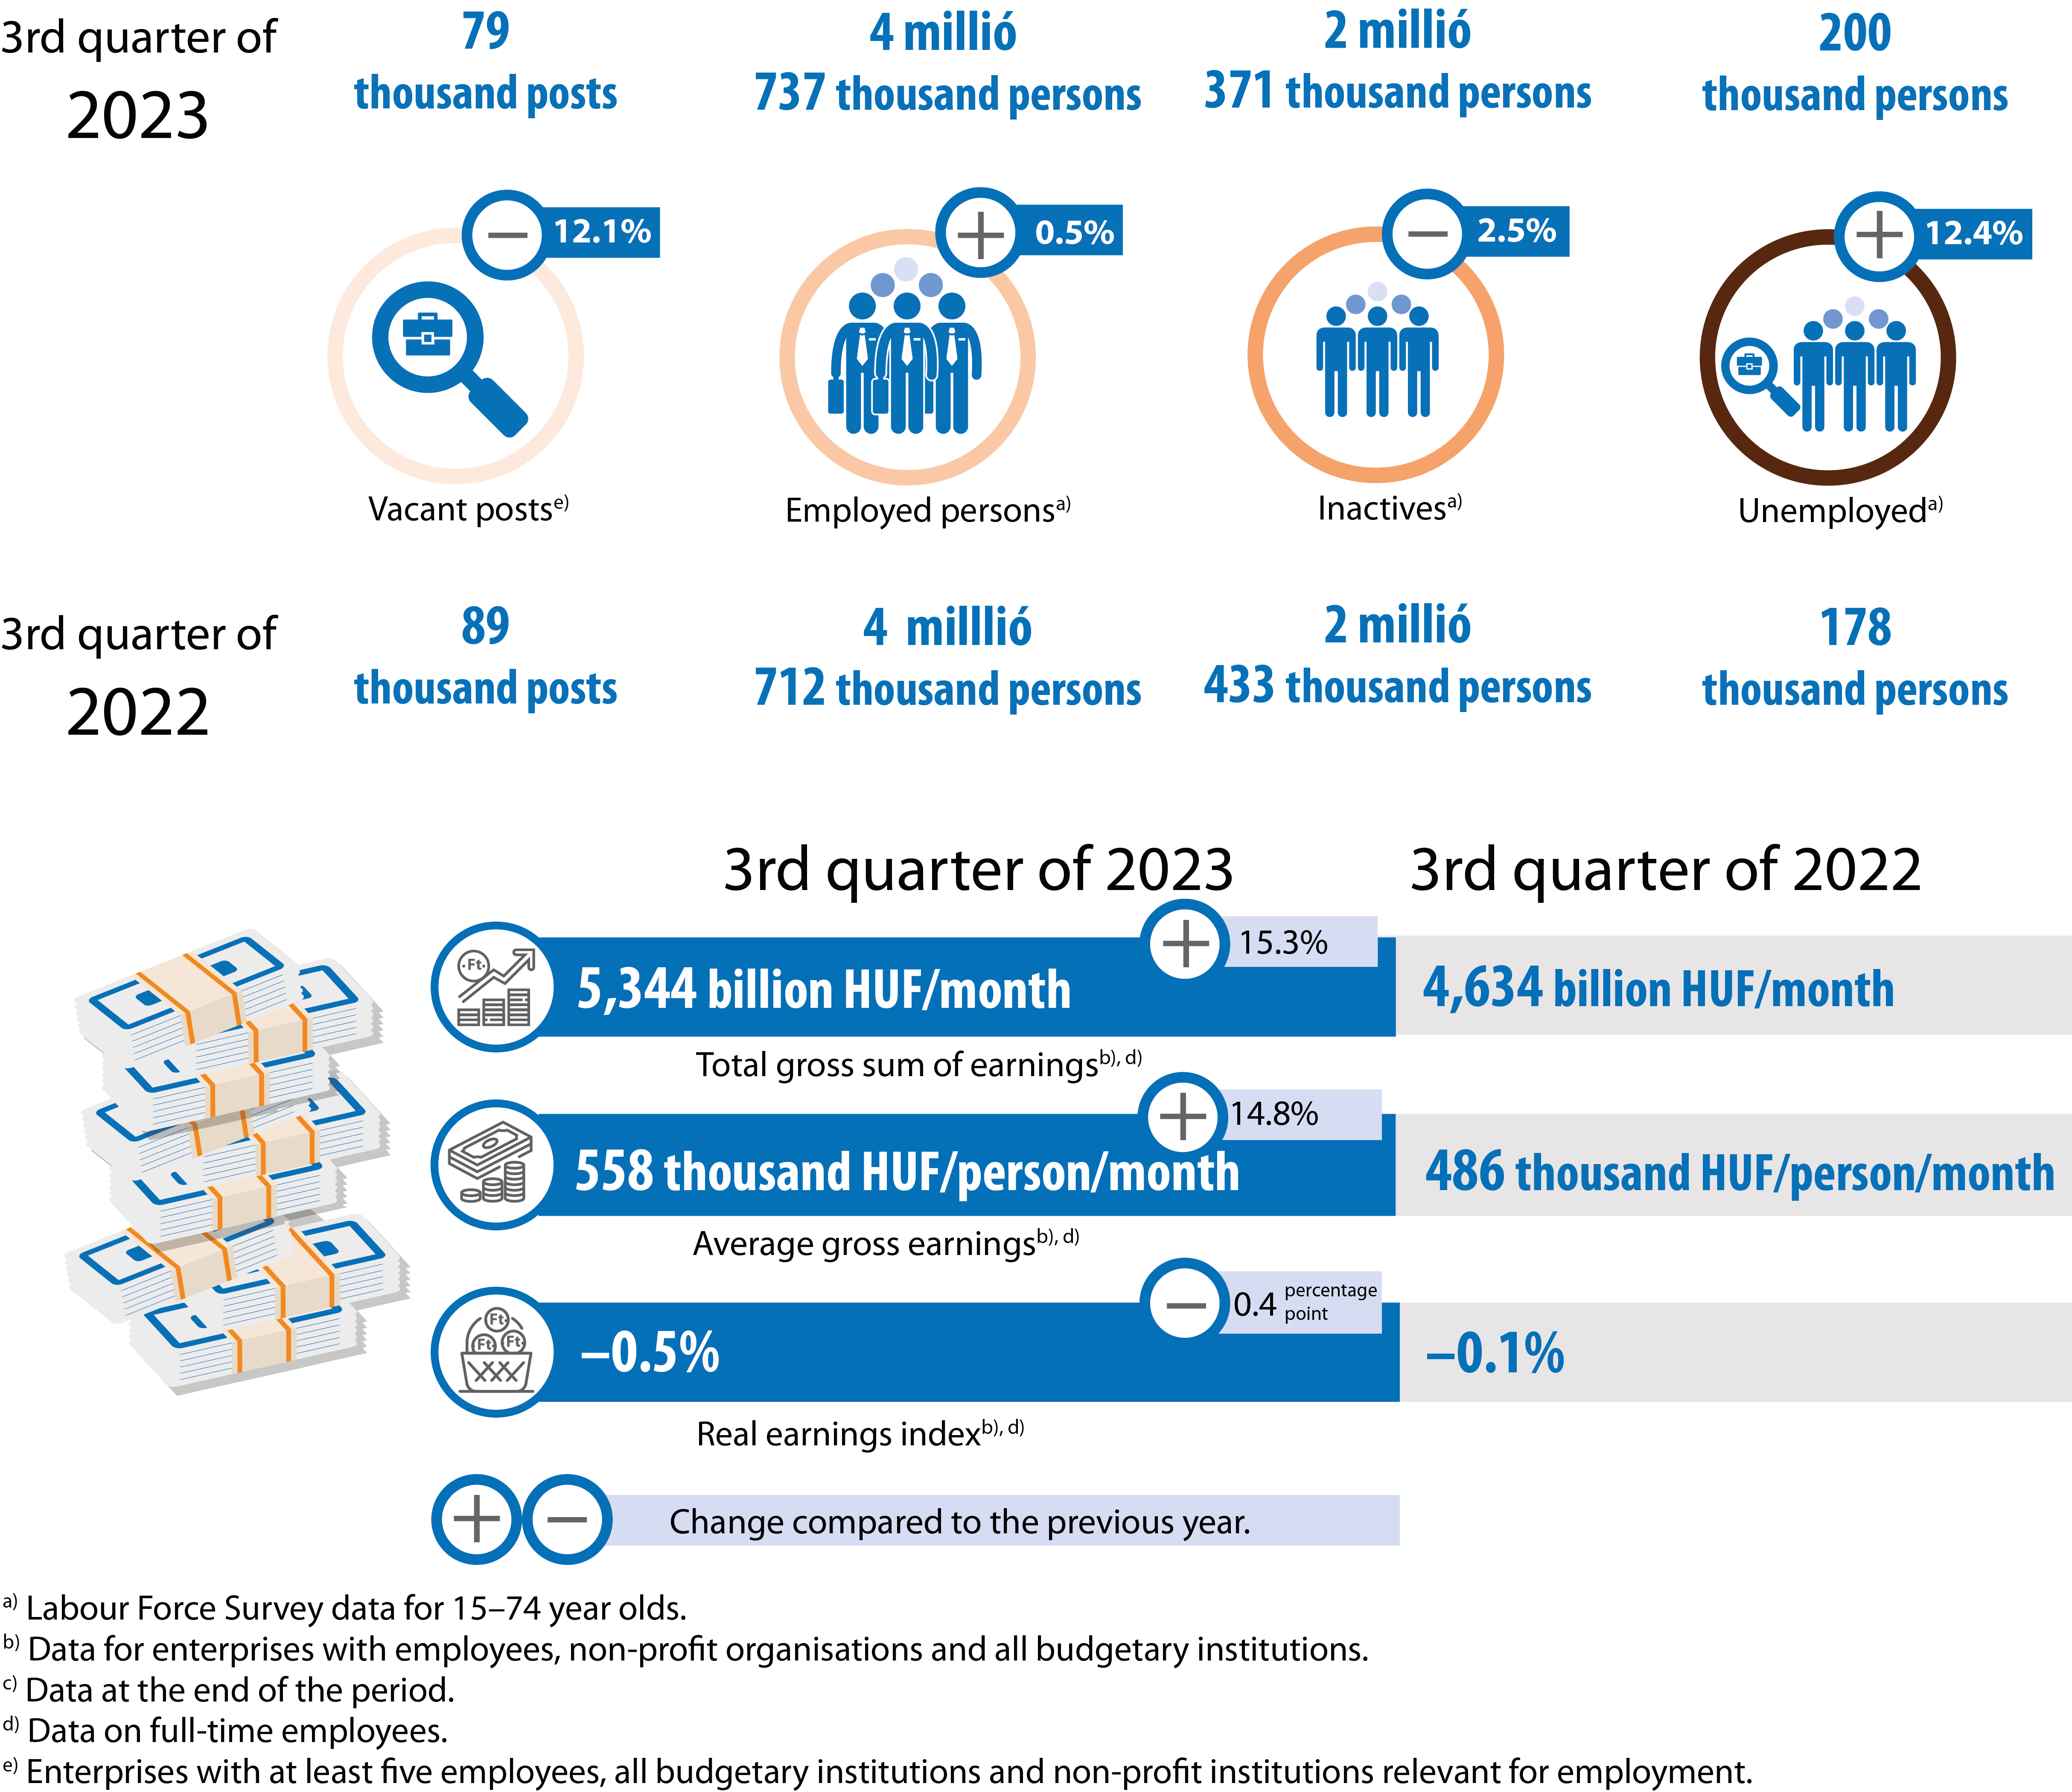
In the third quarter of 2023, the average number of employed persons in the population aged 15-74 was 4 million 737 thousand, 25 thousand more than in the same period of the previous year.
Most of the increase in the number of employed persons was due to an increase of 18 thousand in the number of persons working abroad. The number of people employed in the primary labour market increased by a further 13 thousand, while the number of people in subsidised employment as public workers decreased by 6 thousand. The age composition of the employed population is increasingly dominated by older workers (over 55).
The employment rate of 15-64 year olds averaged 75.0% in Q3 2023, 0.4 percentage points higher than in the same period of the previous year
In Q3 2023, the employment rate for men increased by 0.4 percentage points to 79.5% and for women by 0.3 percentage points to 70.5%.
Although the impact of the increase in the retirement age was negligible by 2023 - the retirement age is 65 from 2022 onwards - employment among 55-64 year olds continued to grow. The employment rate in this age group improved the most, rising by 4.4 percentage points in one year to 70.0%, helped by women working while retired. The employment rate for 25-54 year olds remained high at 87.8%, essentially stagnating, after a slight decrease in Q3. The employment rate for 15-24 year olds was little changed at 28.4%.
Győr-Moson-Sopron and Komárom-Esztergom counties have the highest employment rates
Also in Q3 2023, Jász-Nagykun-Szolnok county saw the largest increase in the employment rate of 15-64 year olds, up 4.8 percentage points compared to Q3 2022. The county has the highest rate of growth in a longer period of time. Several counties were affected by the decline in employment, with the largest drop of 5.1 percentage points and the lowest rate in Tolna county, where the employment-to-population ratio was 67.8%. The employment rate was highest in Győr-Moson-Sopron (81.4%) and Komárom-Esztergom (79.6%), ahead of Budapest. The difference between the most and least favoured counties was 13.6 percentage points.
Market services saw the largest incerase in the number of employeesAn employee shall be considered to be employed if he/she has an employment relationship with the employer and is/may be obliged to perform at least 60 hours of work on average per month for a fee under his/her employment contract or employment agreement. The average number of employees includes all employees, excluding persons permanently absent from work for specified reasons (e.g. maternity leave, persons not working for various childcare reasons, and from 1999 onwards, persons on sick leave for more than one calendar month, persons on unpaid leave, etc.).[1] compared to last year
The number of people in employment increased by 40 thousand, excluding public workers, and although the increase in employment remained significant, it slowed down over the year. The largest absolute increases were in market services, including administrative services (+9,100) and professional scientific activities (+8,800), but there were also high rates of growth in real estate activities, accommodation and food services and information and communication. Within administrative services, temporary employment agencies grew most significantly due to an increase in the number of foreign workers, while the increase in scientific and technical activities and information and communication was significantly influenced by the tightening of the conditions for the itemized tax for small taxpayers (kata), which has led to a large number of self-employed workers continuing to work as employees since September last year.
Growth in industry (+4,700 persons) was driven by a decelerating growth in manufacturing and a smaller expansion in energy industry (+1,200 persons).
In the area of public services, staffing levels in many public administration organisations have been reduced, explained by tight budget management.
The largest fall in employment (-4,600) was in construction, where output was also below last year's level. There were also falls in trade and transport and storage (-2200 and -1000 respectively), explained by a fall in trade and a reduction in postal services.
Increase in unemployment
The average number of unemployed persons in Q3 2023 was 200 thousand, with an unemployment rate of 4.1% for persons aged 15-74. The number of unemployed persons increased by 22 thousand, or 12%, and the unemployment rate by 0.4 percentage points compared to the same period in 2022.
The unemployment rate for men and women was 4% and 4.2% respectively. The unemployment rate rose to 12.4% for 15-24 year olds, 3.6% for 25-54 year olds and remained essentially unchanged at 3.1% for 55-74 year olds.
In the third quarter of 2023, the share of people who had been looking for a job for a long time (at least a year) was 37%, and 42% of the unemployed - almost 83 thousand people - had started looking for a job within 3 months. 23% of the unemployed had never worked or had been out of work for more than 8 years. More than half of the unemployed with work experience have lost their job, or their public work or seasonal work has ended, and a third have quit, paused or closed their business.
Unemployment increased in most counties
In Q3 2023, unemployment increased in most counties compared to the same period of the previous year. The largest increase was in Somogy, where the unemployment rate rose by 3.5 percentage points to 8.8%. The rate in Békés county increased by a similar amount, by 3.2 percentage points to 9.1%, the highest in the country, together with Szabolcs-Szatmár-Bereg county. Unemployment was lowest in Budapest (1.9%) and was below 3% in the six Transdanubian counties with traditionally favourable labour market conditions, as well as in Csongrád-Csanád county.
Slight increase in potential labour reserve
The unemployed, the underemployed and the inactive who intend to work but are not actively seeking work or do not meet the availability criteria together constitute the so-called potential labour reserve.
In the third quarter of 2023, they included on average 294 thousand people, 15 thousand more than a year earlier. The unemployed who are active in the labour market represent an increasing share of the reserve, while the share of inactive people is decreasing. More than one third of those in the potential labour reserve live in the Northern Great Plain and Northern Hungary region, almost 60% have no school leaving certificate, 32% have only a primary education and 14% have a tertiary education. The majority of those who already had work experience had previously worked in manual jobs, typically in manufacturing, construction, trade and public work schemes.
In the last quarters, the labour market has seen more labour reserve for fewer vacancies, but the supply side can only partially meet the demand side's labour needs due to structural (educational, occupational, regional) mismatches.
Labour market flows between economic activity groups within the population aged 15-74 between Q2 and Q3 2023, %
(as a percentage of the Q1 2023 headcount of the activity group concerned)
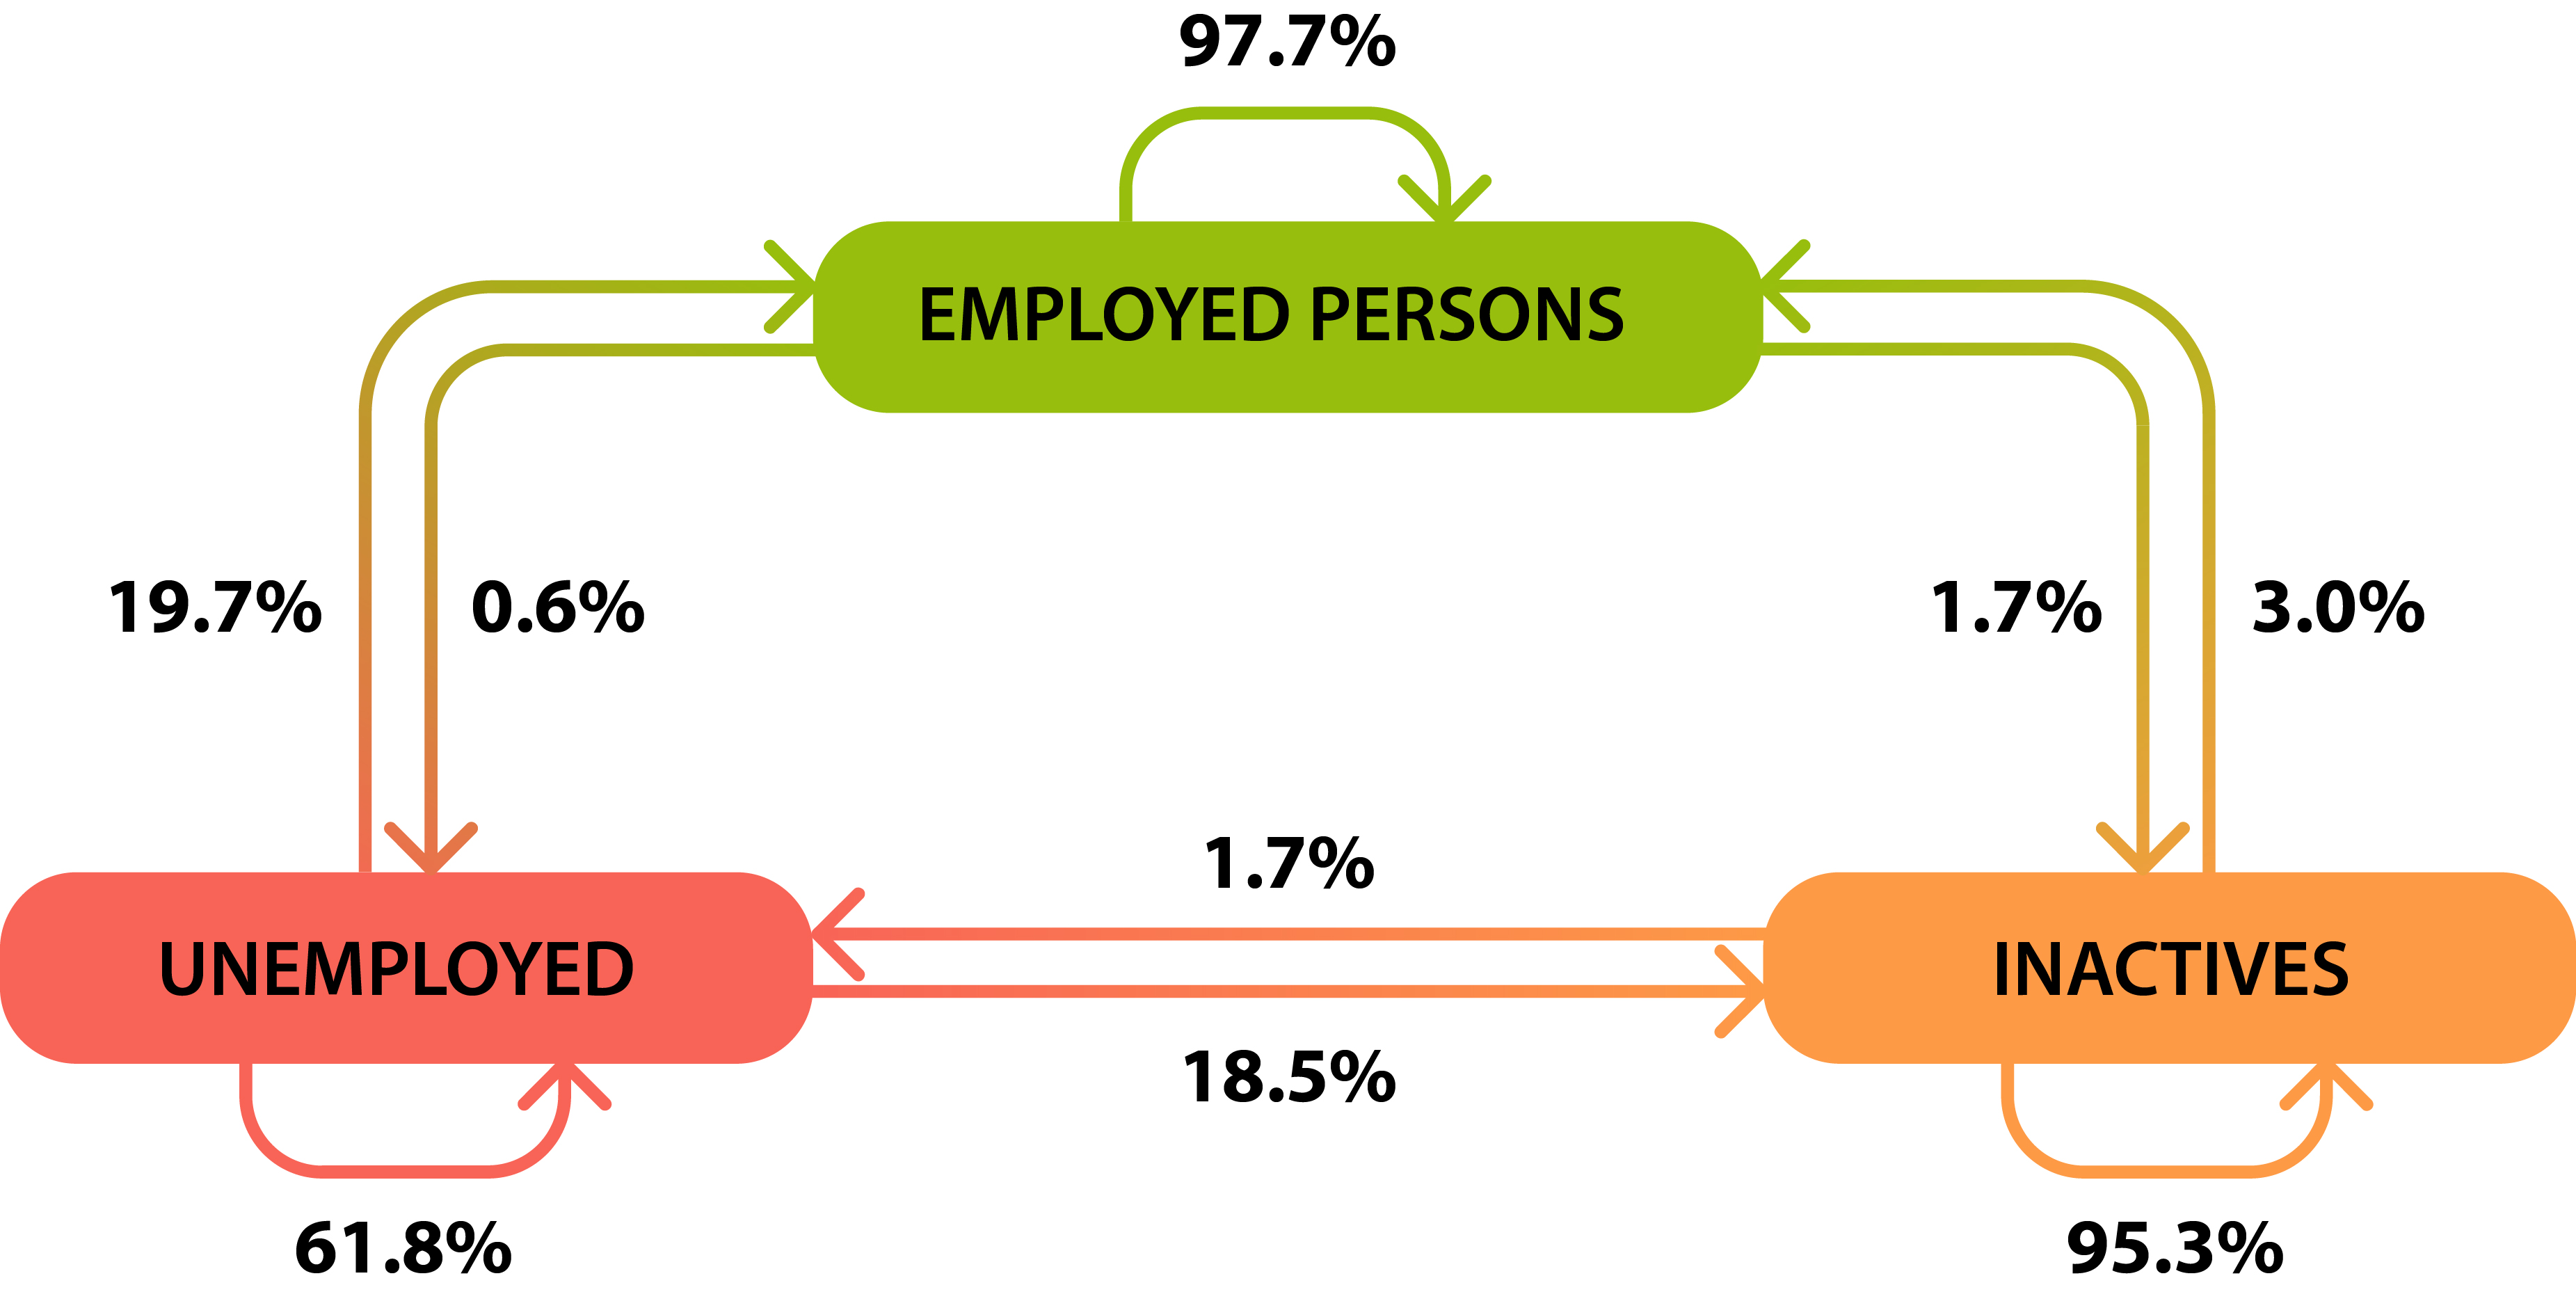
Between Q2 and Q3 2023, there was not much movement between activity groups, with the same number of unemployed and inactive people flowing into the employed as there were flows into these groups from the employed.
The labour market has been characterised by increasing activity over the past year. Both the number and the share of people in employment and actively seeking work have increased, while the share of the economically inactive population has decreased.
79 thousand vacancies to be filled
At the end of Q3 2023, the number of posts that are vacant or will become vacant in the near future was 78 600,Based on data from enterprises with at least five employees, budgetary institutions and non-profit organisations relevant for employment.[2] a decrease of 12% compared to the same period of the previous year, continuing a downward trend. The large decrease in vacancies is mainly related to the business sector, where the number of vacancies fell by 16% and by almost 10 thousand.
Compared to Q3 2022, demand for additional labour has fallen in three quarters of sections. The largest decline was in manufacturing, where the number of vacancies fell by more than 4 thousand, with almost a third of these in transport equipment manufacturing. There were also large falls (over 1 thousand) in vacancies in administrative services, public administration and scientific and technical activities. The demand for additional labour increased by over 500 in accommodation and food services and education.
Administrative services had the highest vacancy rate (4.6%) as a share of total jobs, but there was also a significant shortage in health and social work (3.9%). Mining and quarrying (0.6%), agriculture (1.1%), trade (1.2%) and arts, entertainment and recreation (1.2%) had the lowest labour demand. Nationally, 2.4% of all posts were expected to be filled, 0.1 percentage points lower than in Q3 2022.
Decline in purchasing power of earnings stopped in the last month of the quarter
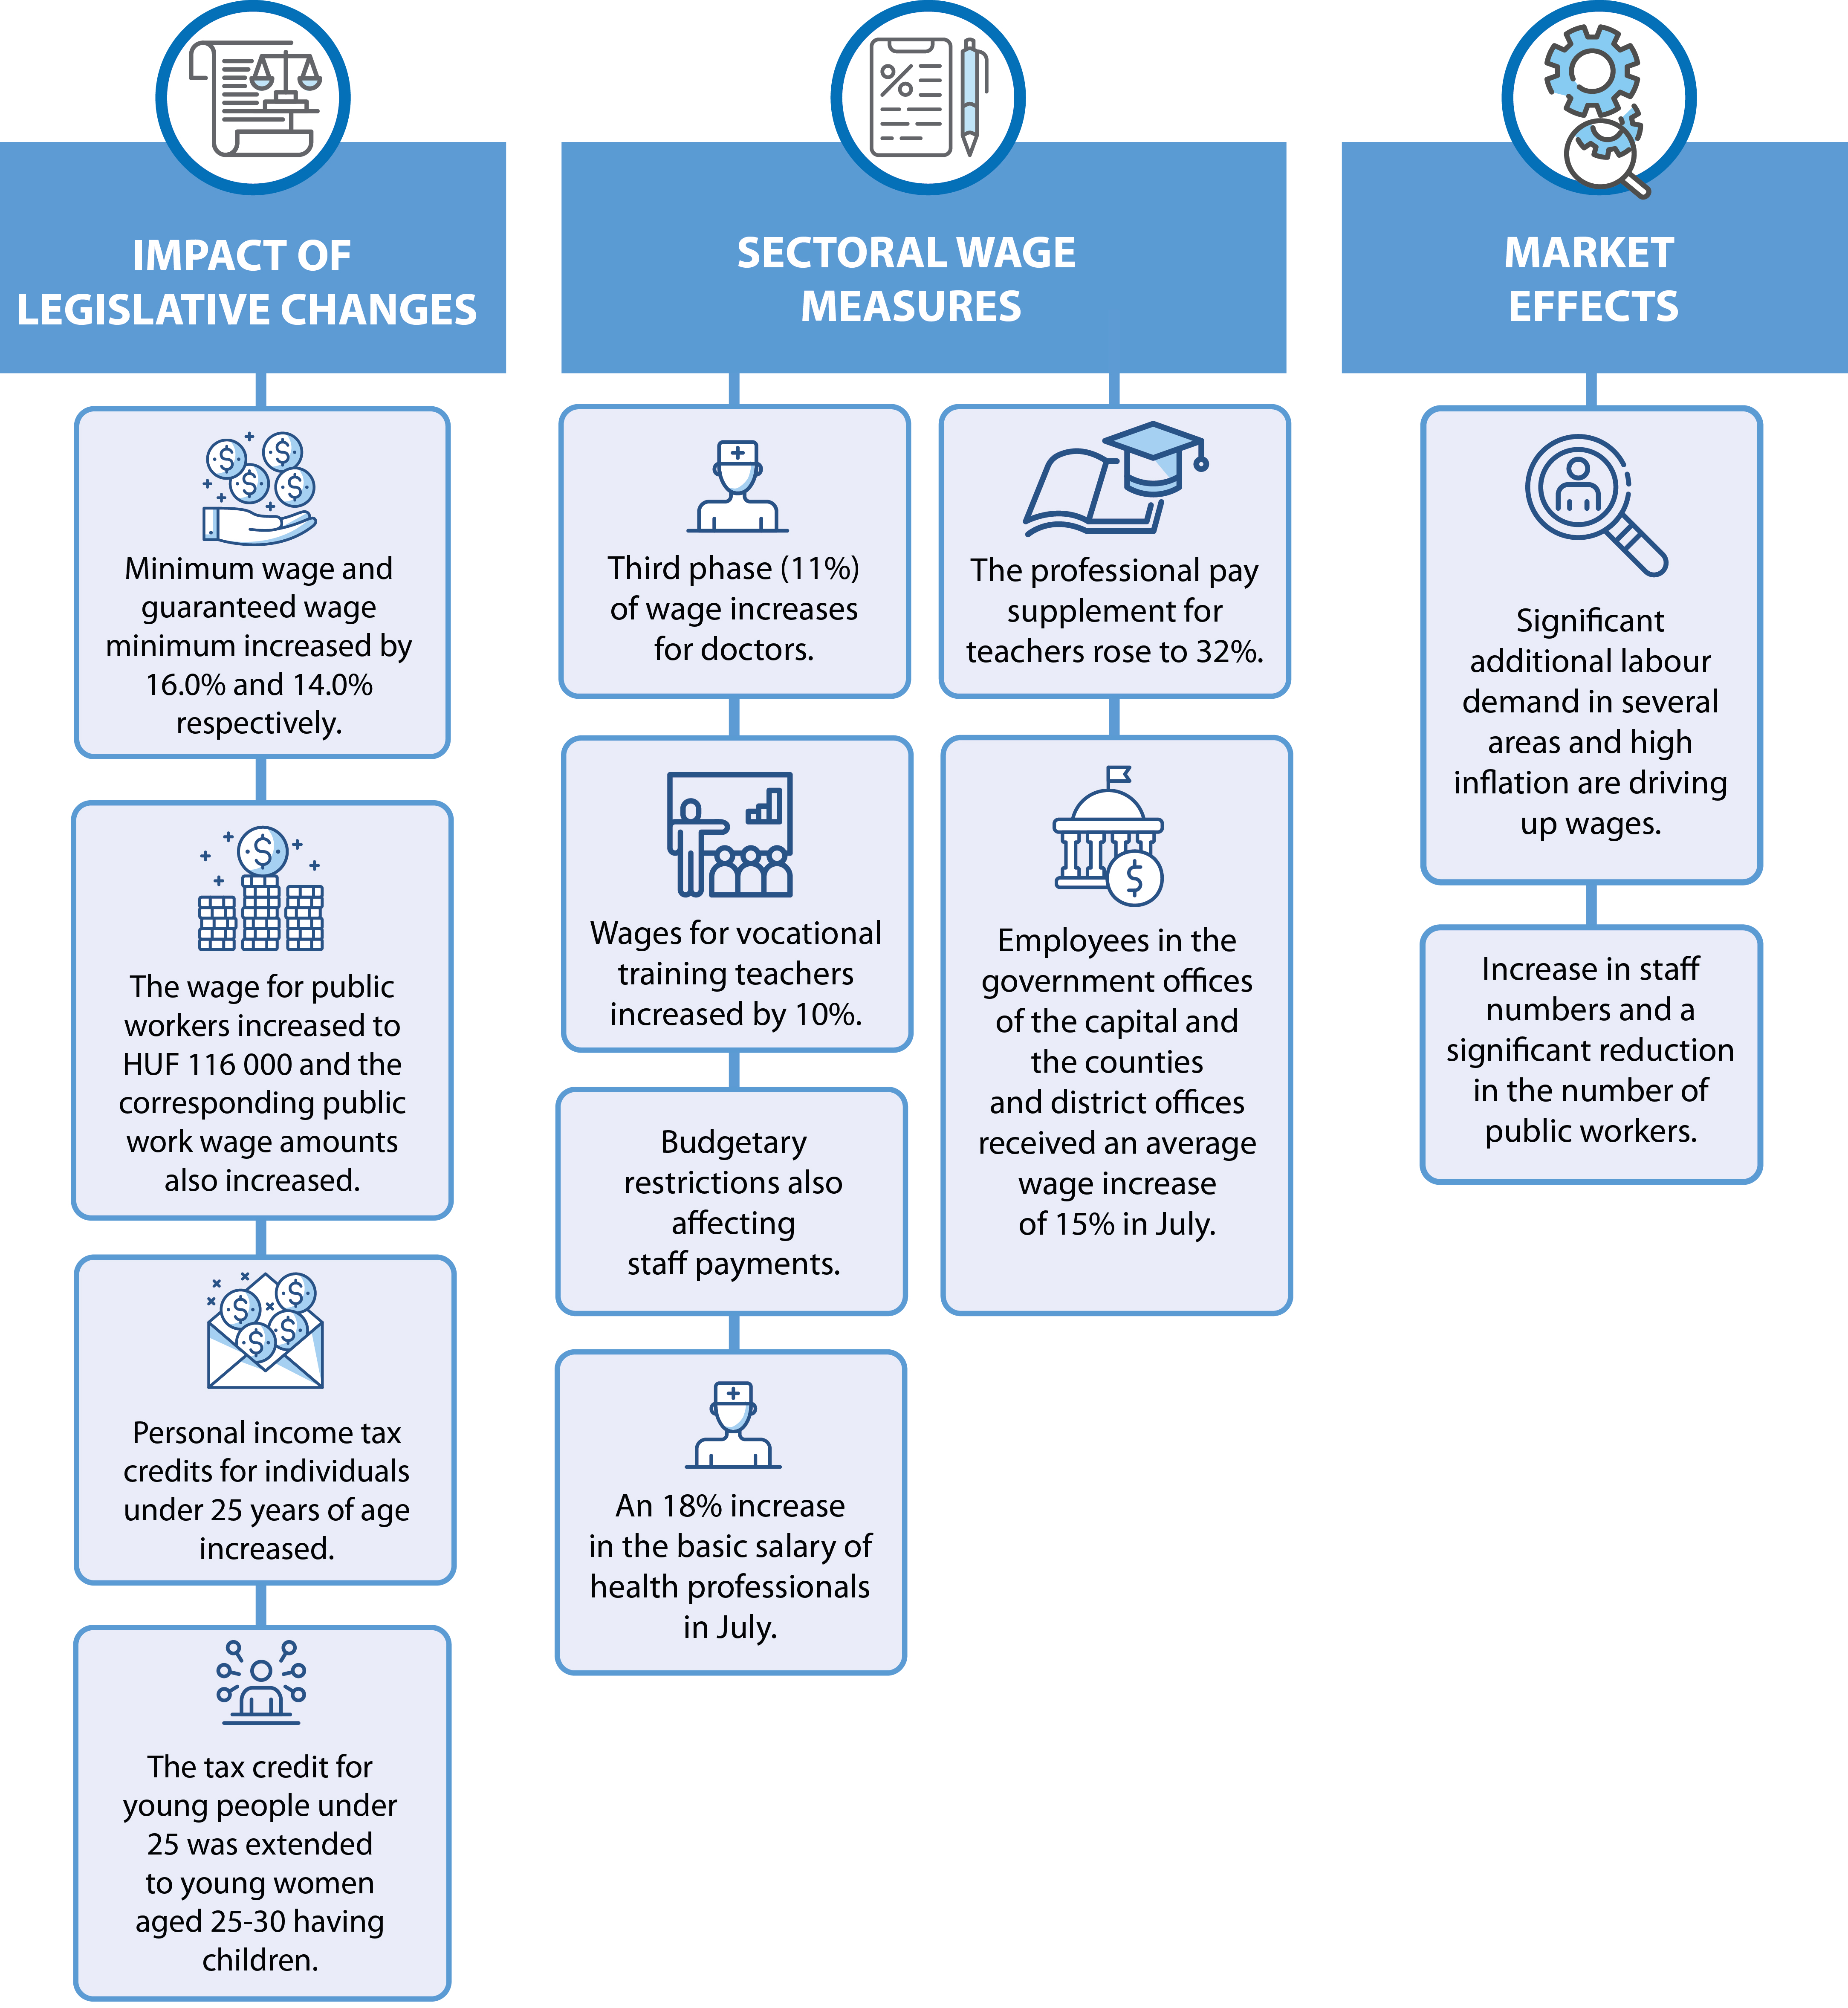
The average gross monthly earnings of full-time employeesAmong enterprises with employees, non-profit organisations and budgetary institutions.[3] reached HUF 557 600 in Q3 2023, 14.8% higher in nominal terms than a year earlier. The intensity of wage growth was strong, but 1.6 percentage points below the level of a year earlier. Last year, wage subsidies and mid-year wage increases, which compensated for rising inflation and rises in overheads, boosted regular earnings growth in the second half of the year, while this year, in line with the usual seasonal pattern, there was little change in the second half.
Despite significant wage growth at the economy-wide level, the purchasing value of earnings fell throughout the quarter (-0.5%), but started to rise again in September as inflation moderated.
Wage growth in the business sector was driven by less intense growth in regular and nonregular earnings than last year. In the government sector, the pace of scheduled wage increases has been much more subdued this year than last, with non-regular earnings in the sector barely rising due to tight fiscal management. In the non-profit sector, the increase in non-regular earnings was more significant than in the other two sectors.
Total, regular and non-regular* average gross earnings, Q3 2023**
| Designation | Total average gross earnings | Of which: | ||
|---|---|---|---|---|
| regular | non-regular | |||
| HUF/person/month | ||||
| Total national economy | 557 649 | 530 765 | 26 884 | |
| Of which staff groups: | ||||
| manual workers | 415 670 | 397 296 | 18 374 | |
| non-manual workers | 688 501 | 653 755 | 34 746 | |
| Of which sectors: | ||||
| business sector | 564 330 | 533 523 | 30 807 | |
| budgetary sector | 533 705 | 517 969 | 15 736 | |
| non-profit sector | 558 733 | 539 602 | 19 131 | |
| Previous year = 100.0% | ||||
| Total national economy | 114,8 | 114,9 | 114,4 | |
| Of which staff groups: | ||||
| manual workers | 115,0 | 115,1 | 114,2 | |
| non-manual workers | 114,2 | 114,2 | 113,8 | |
| Of which sectors: | ||||
| business sector | 115,1 | 115,2 | 114,0 | |
| budgetary sector | 113,8 | 114,1 | 102,9 | |
| non-profit sector | 114,6 | 113,5 | 160,7 | |
* The value of regular and non-regular earnings is based on an estimate.
** Enterprises with employees, non-profit organisations and all budgetary institutions.
Overall, including part-time workers, the full-time equivalent gross average earnings increased by 15.1% to HUF 549 200.
Above average wage growth in industry
In Q3 2023, as in the previous quarters of the year, wage growth was highest in industry (15.5%), driven by strong, albeit slowing, growth in manufacturing (15.4%). Wage growth was the second highest - nearly 20% - in the vehicle manufacturing sector, which has the largest share of employees, but below average in most manufacturing sub-sectors.
Earnings growth was average in market services (14.8%) and below average in public services (11.4%). In the former, the highest increase was in real estate activities, but wage growth was below average in several major branches, such as professional and scientific activities, trade, transport, storage and information and communication.
As a result of subdued fiscal management, wage growth in any branches of public services did not reach the average for the national economy.
Median earnings were 81% of the average
In the third quarter of 2023, median earnings increased to HUF 450 000, rising slightly faster than average gross earnings, by 15.3%. The rise in median earnings was driven by, among other things, an increase in minimum wage rates and above-average wage growth for manual workers in industry. As with regular earnings, the median annual increase was below last year's level.
Growth in net and gross earnings was the same
In the third quarter of 2023, the average net earnings for full-time employees, taking into account benefits and exemptions from taxes and contributions, were HUF 384 700, up 14.8% over a year, in line with the growth in average gross earnings at the economy-wide level. Net earnings grew slightly less than gross earnings in the budgetary sector and more than gross earnings in the business sector. The difference between net and gross earnings growth is mainly explained by the family allowance, which does not grow in line with gross earnings.
Median net earnings, taking into account the benefits, reached HUF 311 600, 15.2% higher than in Q3 2022.
Earnings differentials remain high
Regional differentials in earnings continued to be significant, with the average salary at employers in the capital city almost 70% higher than the average salary in the lowest ranked Szabolcs-Szatmár-Bereg county, 15% higher than the average salary in the second-highest-ranked Győr-Moson-Sopron county and 21% higher than the national average. Regional differences are significantly influenced by the different employment structure, the composition of the employed by sector and occupation, and the different weight of public employment and its changes.
Earnings increased significantly in nominal terms in all counties, with the highest growth in Győr-Moson-Sopron, but above-average wage growth was also recorded in Komárom-Esztergom, Bács-Kiskun and Somogy counties, which have a higher industrial base. In Hajdú-Bihar, Nógrád and Pest counties, market services earnings also increased above average. Lower growth was recorded in Tolna and Vas counties, the former with a lower share of employment in industry, which is characterised by higher wage growth, and the latter with below average wage growth in the large industrial base.
Hungary's employment rate remains above the EU average
Within the EU, the Netherlands had the highest employment rate (82.6%) and Italy the lowest (61.6%) in Q3 2023. Hungary, with a rate of 75%, 4.3 percentage points above the EU average, was in the top third of Member States. Among the V4 countries, the Czech Republic had the highest employment rate (75.3%) and Slovakia the lowest (71.9%), but all four countries were above the EU average (70.7%).
The employment rate for men was highest in Malta (87.1%) and lowest in Croatia (69.8%). The 79.5% rate for men in Hungary was 4 percentage points above the EU average and the sixth highest in the EU.
The employment rate for women was highest in the Netherlands (79%) and lowest in Italy (52.2%), while the 70.5% rate for Hungarian women was 4.6 percentage points higher than the EU average.
Within the European Union in Q3 2023, Malta had the lowest unemployment rate (2.5%) and Spain the highest (11.8%). Hungary ranked eighth among EU Member States with an unemployment rate of 4.1%, 1.8 percentage points lower than the EU average (5.9%). For both sexes, the unemployment rate in Hungary was lower than the EU average.
Hungary's demand for additional labour is slightly below the EU average
In the third quarter of 2023, there were 2.6 vacancies[4] for every 100 posts in the European Union, 0.3 percentage points lower than in the same quarter of last year and 0.1 percentage points lower than in the previous quarter. Belgium, the Netherlands, Austria and Germany had the highest levels of demand for additional staff, with rates above 4%, while the lowest were in Bulgaria, Romania, Spain and Poland, with rates below 1%. In Hungary, the vacancy rate of 2.4% was also slightly down on last year, but still above half of the EU Member States, including neighbouring Romania, Slovakia and Croatia.
[1]:↑ An employee shall be considered to be employed if he/she has an employment relationship with the employer and is/may be obliged to perform at least 60 hours of work on average per month for a fee under his/her employment contract or employment agreement. The average number of employees includes all employees, excluding persons permanently absent from work for specified reasons (e.g. maternity leave, persons not working for various childcare reasons, and from 1999 onwards, persons on sick leave for more than one calendar month, persons on unpaid leave, etc.).
[2]:↑ Based on data from enterprises with at least five employees, budgetary institutions and non-profit organisations relevant for employment.
[3]:↑ Among enterprises with employees, non-profit organisations and budgetary institutions.
[4]: Scope: industry, construction, services (excluding activities of households and extraterritorial organisations).
Further data and information
Contact details:
kommunikacio@ksh.hu
Contact us
Telephone: +36 (1) 345 6789
www.ksh.hu