
Introduction
The vast majority of Hungarian households live in their own property. The proportion of rental dwellings in the Hungarian housing market is extremely low, even in European comparison. 6.7% of occupied dwellings, about 260,000 dwellings, were used by residents who rented it from a private owner, according to the 2016 microcensus. In Hungary, 4.8% of the population lived in market rental housing in 2018, while on average in the EU Member States this proportion was close to 21%.https://appsso.eurostat.ec.europa.eu/nui/show.do?dataset=ilc_lvho02&lang=en[1]
Home renting belongs to the ’gray zone’ of the Hungarian housing market
- Many of its actors are hiding, their relationships are changing rapidly, in many respects they do not fit into the conceptual framework of traditional statistical data collection, and its observation is also difficult to solve relying on traditional statistical techniques. Therefore, it is extremely difficult to reliably measure the size, occupants and, last but not least, prices of the rental sector.
- At the same time, renting out private dwellings has spread appreciably in recent years and has now become a key factor in the metropolitan housing market. Today, – in addition to policymakers, market participants, and researchers – lay people also demand statistical information on rental trends. In the absence of reliable data, partial information, data of uncertain origin and validity are circulating in the market.
A significant step forward in this situation is that ingatlan.com offered its advertising database to the Hungarian Central Statistical Office for statistical utilization, to monitor changes in rents. Ingatlan.com has an extremely extensive database of hundreds of thousands of unique advertisements, which is also structured for statistical processing.
- Linking this database with data available from the HCSO system that are relevant from the housing market point of view makes it possible to prepare analyses that none of the contributors could solve individually.
- Another advantage of the cooperation is that it provides much faster access to data than official channels, so that information on this particularly sensitive segment of the housing market can be available within a few days after the reference period.
The current collaboration between ingatlan.com and HCSO was preceded by a research period lasting almost a year. During this period, data was received from the current database of ingatlan.com on a monthly basis.
In contrast to official statistics, our results do not cover the entire examined population, i.e. the rental market, as they are based only on home rental data that appear among the advertisements of ingatlan.com. Nearly half of Budapest landlords and more than a third of those living in county seats contacted their tenants via internet real estate portals, and this ratio is likely to have risen further in the time since, according to the results of the 2018 HCSO rent survey preceding the present research (Private apartment rental, rental prices – main results of the 2018 rent survey.The relevant publication was published only in Hungarian: Magánlakásbérlés, bérleti díjak – a 2018. évi lakbérfelmérés főbb eredményei[2]). The data source available thanks to ingatlan.com is therefore suitable for informing us about the basic processes of the rental market.
Results
Our results provide information on changes in supply prices of rentals, as they reflect the rental price level of dwellings available to those entering the market, which – as we have also shown before – differs significantly from the rental prices of dwellings actually rented in the given period. Most rental prices did not increase after the agreement, so their levels generally reflect the price conditions during the move-in period.
We emphasize that the results published here are experimental statistics, which are based on some novel, innovative solution. Their novelty also lies in the use of new data sources and new methods, but unlike official statistics, they are less robust, they may not cover all aspects of the given phenomenon, but the results still meet most quality expectations.
Population characteristics and Descriptive Statistics
Private rental markets are concentrated in large cities and as the rent survey has also shown, concentration is further increasing in online rental offerings. This also applies to the clientele of ingatlan.com: the vast majority of advertisements refer to dwellings in the capital, on average two–thirds of all advertisements on a monthly basis are advertisements in Budapest. Outside the capital, internet advertisements are basically posted in towns and towns with county status, the share of villages is negligible.
Advertised rental dwellings have an average size of 61.4 m2 and a median size of 53 m2. In comparison the 2018 rent survey had a national average of 56 m2 and a Budapest average of 54 m2.
In Budapest, rents averaged HUF 140,000 in the first half of 2015, which increased to HUF 175,000 by the beginning of 2020, and then decreased to HUF 156,000 in the second quarter due to the onset of the COVID-19 epidemic. A similar trend can be observed in towns and towns with county status: in the former in mid-2015, rents averaged HUF 123,000 and in the latter HUF 90,000. In the second quarter of 2020, the average price level was 138 thousand forints in towns and 108 thousand forints in towns with county status.
In the second quarter of 2020, an average of HUF 3,100 per square meter had to be paid in Budapest, an average of HUF 2,000 in towns with county status and HUF 2,200 in towns.
29.5% of all observations came from private individuals and 70.5% from real estate brokers. The share of real estate brokers shows a declining trend: while in 2015 more than 83.5% of the advertisements were real estate agency advertisements, in 2019 this proportion decreased to less than 61%.
Budapest data, which is prominently represented in the home rental supply, also provides an opportunity for detailed territorial analyses, enabling the calculation of Budapest sub-indices.
Rent index
A hedonic regression estimate was used to monitor the change in rents.We have written more about the applied method and its alternatives in the Methodological Description.[3] Several index computational stratifications have been developed in order to analyse the different market segments in sufficient detail and at the same time examine the impact of different procedures.
Regional stratified index
When calculating a regional stratified index, indices are calculated separately for geographical territorial units, and then the national index is obtained by weighting them. On the one hand, this has the advantage that potentially different territorial trends can be detected. On the other hand, we are thus able to observe the processes related to housing rental at the regional level.
To create a regional stratified index, we did not use only statistical regions: we divided Budapest into five district categories. The five Budapest district categories:
- Buda, hilly districts: I, II, XII
- Buda, other districts: III, XI, XXII
- Pest, inner districts: V, VI, VII, VIII, IX
- Pest, transitional districts: X, XIII, XIV, XIX, XX
- Pest, outer districts: IV, XV, XVI, XVII, XVIII, XXI, XXIII
The index calculated on the basis of 2015 peaked in January 2020, it was 161% in the outer districts of Pest, while in the other district groups the highest value of the rent index was around 140%. Thus the outer districts of Pest show the most dynamic price increase, which is due to the fact that they were characterized by a much lower price level in nominal terms in the base period. In March and April 2020, downtown prices in Pest showed a much steeper decline, which is related to the appearance of Airbnb apartments in the home rental market. This result also confirms the usefulness of stratification within the capital.
Advertiser stratified index
In this case, the indices were constructed by estimating data from two groups: private ads and office ads, and then weighted them. Behind this is the argument that office advertisements tend to include larger, more expensive, sometimes luxury, rental properties, so their price trend could potentially be different.
Index calculated on the basis of advertising prices of dwellings actually rented
Private users of the ingatlan.com advertising interface could indicate if the apartment was actually rented out. The index calculated on the basis of the last rents they report is that of dwellings actually rented. An important result is that, although it relies on a fraction of the amount of data used for previous indices, in most cases the index fits closely with the index calculated on the basis of the ask prices of private advertisements.
Aggregate index
The solution, which included all cases in one model, did not result in a significant deviation from the stratified and then aggregated indices. Each index reached its maximum in January 2020, with the lowest value in the case of a common model (143% of the base). Regional stratification was 2 percentage points higher and advertiser stratification an additional 2 percentage points higher. The index calculated on the basis of actually rented dwellings was even higher at the beginning of 2020 (158% of the base). From February 2020 onwards, all indices reversed and the results were similar, with the March decline proving particularly strong with each procedure, with one exception, each index measured a rent decline of around 5%, while the index of private dwellings actually rented fell by 6.5%. By April, the decline had moderated somewhat (to 3 and 4%, respectively), and in May, advertised rents again rose by around 4%. In June, each index fell slightly, this time it was the lowest in the case of private dwellings actually rented out, at only 0.4%.
By April 2020, presumably due to the uncertainty caused by the COVID-19 epidemic and the increase in supply caused by Airbnb apartments entering the market, the national price level had fallen to the 2018 level. In Budapest, we can detect a decrease of at least ten percentage points per district, however, the inner districts of Pest saw a fall of more than 15 percentage points.
Methodological description
Features of the ingatlan.com database
The database has been available to us since May 2015, and from then on we can present changes in rental prices.
The database fully contains the following variables: settlement (district in Budapest), county, type of property (apartment or family detached house), subtype of property (for example: prefabricated dwelling, condominium), advertiser (apartment or office ad), advertisement status, floor area, advertising price, type of heating, number of rooms, number of half rooms, condition of property, air conditioning, number of bathrooms.
Additional, partially filled in information is also displayed: street, floor, district/neighbourhood, plot area, terrace area, comfort level, renovation level, utility fees, rental price, and parking. The database contains the status of the given observation, i.e. whether the ad is currently available (active) or not (inactive, archived, deleted). In addition, advertisers had the opportunity to state the reason for the termination of the ad (rented out, ads elsewhere, entrusted a realtor, etc.) when removing the ad. However, since the answer to this is optional, it is not fully complete. Although few users take advantage of this opportunity, this information has allowed us to investigate whether there is a discrepancy between the index calculated on the basis of advertisements appearing as supply and that calculated only on the basis of the rental price of apartments actually rented.
There is also an observation as to whether the apartment in question is furnished or unfurnished, but as stated by the HCSO's 2018 rent survey, this did not prove to be a significant explanatory variable for rental prices.
The ingatlan.com database makes it possible to identify multiple-advertisements, and this solves the most difficult problem for advertising databases, the bias caused by repeated advertisements. This can otherwise be a particularly serious problem in the real estate market, mainly due to the large number of ads multiple-placed by intermediaries.
Data preparation
718,721 records were available in the database. First, we performed an outlier screening on these, where we excluded all monthly rents above one million forints and less than ten thousand forints, and only observations under 6 half rooms and 10 rooms were taken into account.
In addition, we filtered out duplicates from the sample (prioritizing the very first closed ad posted by a private advertiser). After these screenings and the second outlier filtering calculated from the model, the final calculations were performed for 298,118 observations.
To check the outlier filtering calculated from the model, we used an alternative, local outlier filtering technique, the so-called Local Outlier Factor method (Breunig et al. (2000)).
Inclusion of HCSO data
Use of data collected by HCSO clarifies models and makes indexes more reliable. The data used can be divided into several groups:
- Geographical classifications: classification by settlement type, region and agglomeration status. These classifications appear as categorical explanatory variables in the regression models.
- Migration balance: we assume that if a settlement has a high migration rate, it will affect the real estate and rental market: high migration, for example, can raise rental prices.
- Level of household income: taking into account the PIT-tax-base per permanent resident, which is based on the assumption that local incomes have a fundamental impact on local housing market prices and rents.
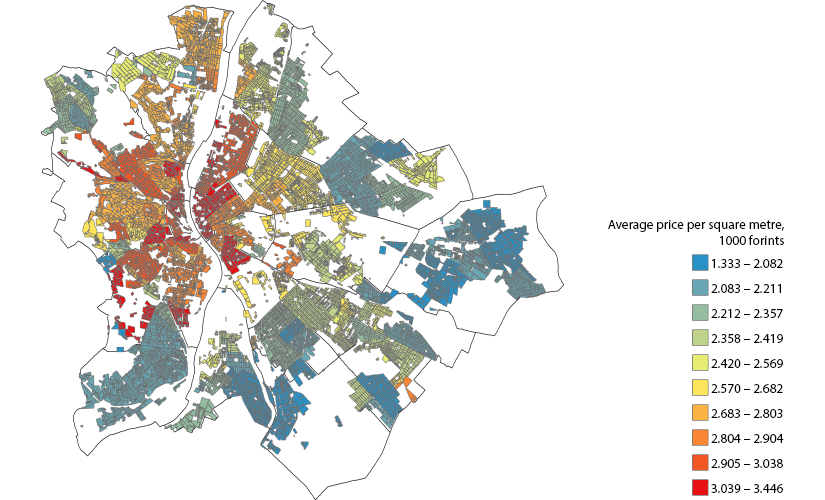
- Average price per square meter per base year at level of settlement or district: a geographical comparison of housing market sales and real estate.com rental advertising data revealed that the geographical distribution of prices observed in the two markets correlated with each other: rental prices are more expensive where dwellings are also more expensive. This effect was incorporated into our model using the transaction data used to calculate the house price index. The transaction database uses average prices per square meter measured in the 2015 base year, aggregated at settlement level in rural areas, and at district level in Budapest.For the analysis, we took into account the housing market prices in the base period. Districts are represented by the inhabited blocks within them, so they only cover residential areas.[4]
On the methodology of hedonic regression
Rent indices showing changes in home rental prices are determined by hedonic regression analysis performed on different subdivisions.
A similar modelling technique was used for each sub-index and the range of variables involved was the same. All models cover the entire period. Data are available from May 2015. The 2015 data were considered as a control during the modelling, accordingly the calculated indices are included as the 2015 base index. Changes in rents over time – so the rent index itself – are derived from the coefficients of time-dummies formed per month. To monitor the composition effect, we used duly completed housing quality characteristics available in the advertising database, as well as the indicators included in the HCSO databases. The target variable, the floor area and the housing market price level characteristic of the settlement (part) were included in the models by logarithmization, and the categorical variables by transforming them into a dummy form.
Finally, we also calculated the index for the entire supply database in a common model without stratification. As shown in more detail in the results, the total index thus obtained did not differ significantly from the stratified and weighted indices.
Related information
-
National rental indices based on home rental advertisements posted on ingatlan.com
-
Regional rental indices based on home rental ads posted on ingatlan.com
-
Rental indices of Budapest district groups based on home rental advertisements posted on ingatlan.com
-
Average monthly rent based on home rental ads posted on ingatlan.com
-
Average size of apartments for rent based on home rental ads posted on ingatlan.com
Literature used
Case, B., Quigley, J.M., 1991. The dynamics of real estate prices. Rev. Econ. Stat. 73 (1), 50–58.
Case, B., Pollakowski, H.O., and Wachter, S.M., 1991. On choosing among house price index methodologies. AREUEA J. 19 (3), 286–307.
Case, K.E., Shiller, R.J., 1987. Prices of single-family homes since 1970: new indexes for four cities. New England Econ. Rev. (September/October), 45–56.
Gatzlaff, D.H., Ling, D.C., 1994. Measuring changes in local house prices: an empirical investigation of alternative methodologies. J. Urban Econ. 35 (2), 221–224.
Gelfand, A.E., Ecker, M.D., Knight, J.R., Sirmans, C.F., 2004. The dynamics of location in home price. J. Real Estate Fin. Econ. 29 (2), 149–166.
Horváth Áron, Székely G., 2009. Hedonikus módszer alkalmazása a használt lakások áralakulásának megfigyelésében. Statisztikai Szemle, 87/6. 594–607.
Mark, J.H., Goldberg, M.A., 1984. Alternative housing price indices: an evaluation. AREUEA J. 12 (1), 30–49.
Shiller, R.J., 1991. Arithmetic repeat sales price estimators. J. Housing Econ. 1 (1), 110–126.
Shiller, R.J., 1993. Measuring asset values for cash settlement in derivative markets: hedonic repeated measures indices and perpetual futures. J. Fin. 48 (3), 911–931.
[1]:↑ https://appsso.eurostat.ec.europa.eu/nui/show.do?dataset=ilc_lvho02&lang=en
[2]:↑ The relevant publication was published only in Hungarian: Magánlakásbérlés, bérleti díjak – a 2018. évi lakbérfelmérés főbb eredményei
[3]:↑ We have written more about the applied method and its alternatives in the Methodological Description.
[4]:↑ For the analysis, we took into account the housing market prices in the base period. Districts are represented by the inhabited blocks within them, so they only cover residential areas.
Contact
Experts: Gáborné Székely, Antal Ertl, Gergely Mónus
Contact: Contact us!