
Ongoing rise in the number of the employed
In the third quarter of 2019, the employed numbered 4 million 521 thousand in the population aged 15–74, increasing year-on-year by 1.0% and quarter-on-quarter by 0.2% according to the Labour Force Survey. In the first three quarters of the year, employment continued to increase year-on-year by 44 thousand, although at a lower rate than in previous years.
In the first three quarters of 2019, segments of the Hungarian labour market saw similar changes as in recent years, with more people working in the domestic primary labour market and fewer as public workers, resulting in 32 thousand more people in the domestic labour market than a year earlier. According to self-declaration, 115 thousand people worked abroad, 12 thousand more than in the same period last year.
In the first three quarters of 2019, the employment rate of the population aged 15–64 was 70.0%, 0.9 percentage points higher than one year earlier. People remaining in the labour market due to rising retirement age, particularly those over the age of 60 provided a source of growth, while employment among young people aged 15–24 decreased slightly. Following a rapid but slowing decline in previous years, the potential workforce reserve, i.e. the number of employable people, stabilized at around 270 thousand in the first three quarters of 2019, and another 30 thousand part-time workers were available to work additional hours.
In the first three quarters of 2019, employment for both genders continued to grow. Men's employment, which was already much more favourable than that of women, has continued to significantly improve, further widening the gender gap in employment. Women’s lower employment rate is primarily due to their traditional childcare and family responsibilities, resulting in temporary absences from the labour market. In addition, many women take advantage of the early retirement option after 40 years of employment and stop earning. These trigger gender gap peaks among the 30–35 year-olds and the around 60 year-olds.
The 75.2% employment rate for the population aged 20–64 has reached the 75% employment target set in the Europe 2020 Strategy. In the first three quarters of 2019, the employment rate for men (83.0%) was significantly higher than for women (67.5%) in this age group too.
Southern Transdanubia and the Pest region saw the greatest improvement in the employment rate
With little change in most regions, employment rates for 15–64 year olds were highest in Budapest and Western Transdanubia (73.8% and 73.7% respectively), and worst in Southern Transdanubia (65.6%), despite a strong, 1.2 percentage points growth, and Northern Hungary (65.8%) in the first three quarters of 2019. The labour absorption effect of the capital and its surroundings remains significant. In Budapest, the number of the employed increased by nearly 11 thousand to 845 thousand, while in the Pest region by nearly 19 thousand to 611 thousand over a year. Territorial disparities have only slightly waned, with the difference between the rates of the best and the worst performing regions remaining significant at 8.2 percentage points. At a deeper territorial level, there are even more marked disparities, with an employment rate difference of 11.3 percentage points between Győr-Moson-Sopron county (74.2%) and Somogy county (62.8%).
Changes in the number of the employed
| Denomination | Number of the employed | Change in the number of the employed |
|||
|---|---|---|---|---|---|
| 2010 | 2018 | 2019 | 2019–2010 | 2019–2018 | |
| Quarters 1–3 | |||||
| Altogether | 3 726.3 | 4 465.5 | 4 509.6 | 783.4 | 44.1 |
| Man | 1 986.8 | 2 442.8 | 2 477.1 | 490.3 | 34.4 |
| Women | 1 739.5 | 2 022.8 | 2 032.5 | 293.1 | 9.8 |
| Budapest | 713.6 | 834.2 | 845.0 | 131.4 | 10.8 |
| Pest | 477.3 | 592.3 | 611.1 | 133.9 | 18.8 |
| Central Transdanubia | 425.8 | 499.9 | 506.4 | 80.6 | 6.6 |
| Western Transdanubia | 398.9 | 483.1 | 487.2 | 88.3 | 4.1 |
| Southern Transdanubia | 338.1 | 373.3 | 375.2 | 37.1 | 1.9 |
| Northern Hungary | 393.2 | 485.2 | 480.4 | 87.2 | –4.9 |
| Northern Great Plain | 499.8 | 638.9 | 642.0 | 142.2 | 3.2 |
| Southern Great Plain | 479.5 | 558.6 | 562.3 | 82.8 | 3.7 |
| Employed | 3 265.8 | 3 999.1 | 4 029.2 | 763.4 | 30.1 |
| Members of business partnerships and cooperatives | 141.6 | 150.4 | 160.9 | 19.3 | 10.5 |
| Entrepreneur, self-employed | 306.3 | 305.7 | 311.0 | 4.7 | 5.3 |
| Unpaid family workers | 12.5 | 10.3 | 8.5 | –4.0 | –1.8 |
| Working at local units in Hungary | 3 676.8 | 4 362.8 | 4 394.8 | 718.0 | 32.1 |
| of which: declare to be public worker | 73.7 | 154.0 | 112.5 | 38.9 | –41.5 |
| Working at local units abroad | 49.5 | 102.7 | 114.8 | 65.,3 | 12.1 |
Employment is above EU average for men and below EU average for women
In the second quarter of 2019, the 70.0% domestic employment rate for 15–64 year-olds was 0.7 percentage points higher than the EU average. The employment rate was above the EU-28 average (by 2.7 percentage points) for Hungarian men and below the EU-28 average (by 1.2 percentage points) for Hungarian women.
We are still lagging behind in terms of employment rates for young people and the aging population (by 7.3 and 3.8 percentage points, respectively), and this gap is persistent and increasing for young people. In contrast, 84.6% of the 25–54 year-olds – the so-called 'best working age' people – were considered employed in the second quarter of 2019, making Hungary one of the mid-ranking EU member states. Within this, men ranked fourth with a 90.8% employment rate, after the Czech Republic, Malta and Slovenia, while women were in the middle (78.3%).
In Hungary, relatively high employment was combined with one of the lowest unemployment rates in the Union: in the second quarter of 2019, only the Czech Republic, Germany and Poland had lower unemployment rates than Hungary (3.3%). However, youth unemployment is also a problem in Hungary: the unemployment rate of 15–24 year olds is 10.8%, which is 3.3 percentage points lower than the EU average, but we are in the middle of the ranking of the member states.
Employment and unemployment rates in EU Member States, 2nd quarter of 2019 Country
| Country | Employment rate | Unemployment rate, %b) |
|||||
|---|---|---|---|---|---|---|---|
| 15–24 | 25–54 | 15–64 years-olds | |||||
| year-olds | male | female | together | ||||
| % | changea) | ||||||
| Austria | 49.8 | 85.6 | 78.0 | 68.8 | 73.4 | 0.4 | 4.5 |
| Belgium | 25.7 | 81.4 | 69.2 | 61.9 | 65.6 | 1.9 | 5.3 |
| Bulgaria | 21.2 | 83.1 | 74.0 | 67.3 | 70.7 | 2.8 | 4.2 |
| Croatia | 27.0 | 77.6 | 67.8 | 55.8 | 61.8 | 0.7 | 6.1 |
| Cyprus | 32.9 | 83.3 | 76.1 | 66.6 | 71.2 | 1.8 | 6.5 |
| Czech Republic | 27.4 | 87.4 | 82.0 | 67.8 | 75.0 | 0.3 | 1.9 |
| Denmark | 55.1 | 82.4 | 77.8 | 72.2 | 75.0 | –0.7 | 4.7 |
| Estonia | 39.8 | 83.9 | 78.2 | 71.3 | 74.8 | 0.0 | 5.1 |
| Finland | 49.3 | 83.2 | 75.0 | 72.4 | 73.7 | 0.7 | 7.7 |
| France | 29.8 | 81.1 | 68.9 | 62.7 | 65.7 | 0.2 | 8.1 |
| Germany | 47.8 | 85.3 | 80.4 | 72.4 | 76.5 | 1.1 | 3.1 |
| Greece | 14.9 | 71.6 | 66.4 | 48.0 | 57.1 | 1.8 | 16.9 |
| Hungary | 28.2 | 84.6 | 77.1 | 63.0 | 70.0 | 0.7 | 3.3 |
| Ireland | 40.2 | 79.8 | 74.6 | 63.7 | 69.1 | 0.6 | 5.4 |
| Italy | 18.6 | 70.8 | 68.2 | 50.7 | 59.4 | 0.3 | 9.8 |
| Latvia | 28.2 | 83.5 | 73.1 | 70.9 | 72.0 | 0.3 | 6.4 |
| Lithuania | 32.1 | 85.0 | 74.0 | 72.1 | 73.0 | 0.9 | 6.2 |
| Luxembourg | 29.4 | 85.0 | 72.6 | 63.9 | 68.3 | 2.1 | 5.3 |
| Malta | 47.3 | 85.8 | 80.7 | 64.6 | 73.1 | 1.9 | 3.4 |
| Netherlands | 65.6 | 85.2 | 82.2 | 74.0 | 78.1 | 1.1 | 3.3 |
| Portugal | 27.1 | 85.3 | 73.1 | 67.9 | 70.4 | 0.6 | 6.3 |
| Romania | 25.6 | 82.2 | 75.1 | 57.5 | 66.4 | 0.9 | 3.8 |
| Slovakia | 24.7 | 81.5 | 74.1 | 61.9 | 68.1 | 1.0 | 5.7 |
| Slovenia | 33.8 | 89.0 | 75.8 | 68.9 | 72.5 | 1.4 | 4.2 |
| Spain | 22.0 | 76.0 | 68.8 | 58.1 | 63.5 | 1.0 | 14.0 |
| Sweden | 43.6 | 87.1 | 78.8 | 76.3 | 77.6 | –0.2 | 7.0 |
| United Kingdom | 49.7 | 84.7 | 78.8 | 71.1 | 75.0 | 0.5 | 3.7 |
| EU-28 | 35.5 | 81.2 | 74.4 | 64.2 | 69.3 | 0.7 | 6.2 |
a)Q2 2019 compared to Q2 2018, percentage points.
b)Calculated for 15–74 year olds.
Source: Eurostat (situation as of 13 November 2019).
Slowing growth in employment
Enterprises employing at least five people, budgetary institutions and significant non-profit employers employed an average of 3 million 185 thousand people, 0.6% more than in the same period last year, based on data from the Intra-year Institutional Labour Statistics System for the first three quarters of 2019. The number of employed persons increased by 1.6% excluding public workers. Growth slowed down compared to the beginning of the year (The last three months of the period under review – July, August, and September – showed virtually no year-on-year growth.)
- Enterprises employing at least 5 people employed an average of 2 million 233 thousand people in the first three quarters of 2019, 2.3% more than a year earlier. Growth was mainly driven by expansion in construction, where 8.4% more people were employed than a year earlier. The number of people employed in catering, scientific and technical sectors also increased by more than 5%.
- Budgetary institutions, employing 787 thousand people including public workers, saw a 4.0% decrease in staff numbers. Headcount reduction mainly resulted from declining employment in workfare programs and in the section of public administration, defence and compulsory social security. Calculated without public workers, the number of employees decreased by 1.3% in one year.
- 164 thousand people were employed by significant non-profit employers, 1.1% more than a year ago
Full-time employment increased by 0.6% and part-time employment by 0.4% over a year to 2 million 852 thousand and 332 thousand respectively (including public workers). Within employment, the number of foreign-nationals significantly increased year-on-year by 31% to 51 thousand in the first nine months of 2019. Most of them came from Ukraine (15 thousand).
In the first three quarters of 2019, an average of 102 thousand were employed as public workers. The monthly headcount of public workers exceeded 110 thousand in the first two months of the year, and after a decline in March, it stabilized at around 98-102 thousand from April. Many quit public work, with 23% fewer people working in workfare programs in the first three quarters of 2019 than one year earlier.
Public workers declined not only in numbers but also in their ratio to all employees during the year. In the first three quarters of 2019, the ratio of public workers to total employees increased year-on-year by 1.0 percentage points to 3.2%. 87% of public workers – 89 thousand in total – were employed by budgetary institutions, 9% by major non-profit employers, and the remainder by enterprises employing at least 5 people.
High, but declining, additional labour demand
At present, the Hungarian labour market is still characterized by high labour demand, but needs are lower than a year earlier. In the third quarter of 2019, employers1 reported that the number of vacancies or expected vacancies for which the employer is taking active steps to fill in exceeded 78 thousand. One year earlier, when the shortage of workforce so calculated peaked, the economy would have needed about 88 thousand additional workers.
In Q3 2019, companies reported 53 thousand job vacancies, accounting for 68% of all job vacancies. Of the sectors, a further 21 thousand employees would have been needed in budgetary institutions and 4 thousand in non-profit organizations. One year earlier, staffing requirements in the private sector were higher not only in numbers but also in their ratio to total labour demand. (At that time, 72% of the additional need came from businesses with at least 5 employees.)
In the third quarter of 2019, the vacancy rate fell year-on-year to 2.4% including a decline to 2.3% in the private sector and a slight rise to 3.0% in the budgetary sector. (In Q3 2018, the vacancy rate for both sectors was approximately the same, at 2.8-2.9%, relative to the total number of vacancies2.)
The following areas were characterized by high labour shortages:
- human health and social care (4.2%),
- information and communication (3.3%),
- administrative services3 (3.1%),
- manufacturing (2.7%),
- and transportation and storage (2.7%).
In addition, vacancy rates were higher than the national average in construction (2.6%) and public administration (2.5%). Compared to the total number of jobs, the smallest unmet need for employment was in agriculture (1.1%) and arts and leisure (1.3%).
In the second quarter of 2019, there were 2.3 job vacancies per 100 jobs in the European Union, up 0.1 percentage point from the same period last year, according to the latest international figures. The vacancy rate continued to be highest in the Czech Republic, with 6.2 vacancies per 100 jobs, while the other pole is Greece with 0.7 vacancies. In Hungary, the 2.5% vacancy rate for the second quarter of 2019 was slightly above the EU average.
In addition to statistics based on EU standards, but using a different methodology, the National Employment Service (NFSZ) measures labour demand. A total of 35 thousand job vacancies were reported in the last month of the reporting period (September 2019) based on demand from employers. As employers are basically interested in reporting 'vacancies to be filled in a supported form', slightly more than half of the vacancies registered here were for 'subsidized jobs'. 35% of the new vacancies were concentrated in Borsod-Abaúj-Zemplén County, Budapest and Szabolcs-Szatmár-Bereg County. In September 2019, the number of registered vacancies was 111 thousand, of which 33 thousand were filled during the month, leaving 78 thousand vacant at the closing date, roughly the same as based on data from the intra-year institutional labour statistics system. All three NFSZ values were lower than a year earlier, of which the closing-day number decreased by 9.9%.
Ongoing decline in time spent searching for a job
In the first three quarters of 2019, the average number of unemployed people, as defined4 by the United Nations Specialized Labour Organization (ILO5), fell year-on-year by 13 thousand to 161 thousand and the unemployment rate declined by 0.3 percentage points to 3.5%. The improvement was clearly due to a decrease in female unemployment, while male unemployment remained virtually unchanged. With a 0.6 percentage point decrease in the female rate, the rates of the two genders became almost equal, 3.4 and 3.5%, respectively. Youth unemployment rate increased by 0.9 percentage points to 11.1% compared to the first three quarters of 2018, driven by a significant decline in the employment rate of men aged 15–24 (their unemployment rate increased by 2.4 percentage points), while unemployment among young women improved (their rate decreased by 1.2 percentage points).
The number of months spent searching for a job has decreased over the past year. In the first three quarters of 2019, the average duration of unemployment was 13.6 months, representing a 2.5-month improvement over the same period in 2018, when the average job search lasted 16.1 months. As a result of the improving labour market environment, the number of unemployed people looking for a job 12 months or more has declined as job search time dropped. The share of long-term job seekers (jobseekers for at least one year) dropped to 35.8%. At the same time, the proportion of those who have been looking for a job for at least two years has decreased less and is still high (19%).
Northern Great Plain saw the highest unemployment rate
In the first three quarters of 2019, the unemployment rate for the 15–74 age group was the lowest in Western and Central Transdanubia, at 1.8% and 2.0% respectively. Although unemployment in the Northern Great Plain has not increased compared to the same period last year; but the unemployment rate remained the highest here at 6.5%. In most regions, the unemployment rate has stagnated or decreased slightly, a significant change was observed only in Southern Transdanubia, where the rate dropped by 1.1 percentage points to 4.6%, but within this it remained high in Baranya County at 6.2%.
Despite the overall improvement in the labour market situation, regional disparities remain significant. While the unemployment rate in the first three quarters of 2019 was 1.0% in Veszprém County and 1.1% in Győr-Moson-Sopron County, the unemployment rate in Szabolcs-Szatmár-Bereg County was 8.3%.
Further decline in the number of registered jobseekers
The National Employment Service registered an average of 255 thousand jobseekers in the first three quarters of 2019, 1.5% less than a year earlier. With the decline in the cyclical nature of public employment following the March peak, the number of registered jobseekers has been steadily declining since April. During the period under review, 54.8% of registered jobseekers received some form of cash benefit, half of them received social assistance unchanged since years at HUF 22 800 per month and about the same were entitled to jobseeker's allowance.
Registered jobseekers
| Period | Registered jobseekers |
Of which: | |||
|---|---|---|---|---|---|
| career starters | eligible for jobseekers’ allowance or assistance |
social benefit recipients |
without any provision |
||
| Q1–Q3 2018, thousand people | 259.3 | 25.4 | 63.7 | 77.4 | 118.2 |
| Q1–Q3 2019, thousand people | 255.3 | 23.1 | 69.3 | 70.5 | 115.5 |
| Change compared to Q1–Q3 2018,% | –1.5 | –8.7 | 8.7 | –8.9 | –2.3 |
2.3 Source: National Employment Service, Register (http://nfsz.munka.hu).
Compared to previous years, the number of those who were unemployed by their subjective judgment or self-classification also decreased significantly. In the first three quarters of 2019, an average of 287.8 thousand classified themselves into this category.
Nearly two-thirds of inactive people of working age are women
In the first three quarters of 2019, the number of inactive persons (15–64 years) considered to be of working age continued to decline. Changes in student numbers are mainly attributable to demographic reasons but have also been affected by favorable real-world processes. The economy, experiencing significant labour shortages in some areas, already requires the use of more expensive labour, which makes it attractive for students, particularly those in tertiary education, to work during their studies.
The significant decline in the number of pensioners and annuity recipients is primarily due to the continuous increase in the retirement age in the period lasting to 2021, but state incentives also play a role. In early 2019, the state introduced new benefits to support the employment of pensioners.
Inactive population aged 15–64 by reason of absence from the labour market
| Denomination | Quarters 1–3 2019 | Change compared to quarters 1–3 2018, % | ||||
|---|---|---|---|---|---|---|
| men | women | together | men | women | together | |
| thousand people | ||||||
| Pensioners, annuity recipients | 202.8 | 366.9 | 569.6 | –13.6 | –4.0 | –7.6 |
| Child care provision recipients | 1.5 | 222.4 | 223.9 | 24.0 | –4.5 | –4.3 |
| Jobseekers’ provision recipients | 18.6 | 25.3 | 43.8 | 22.6 | 10.7 | 15.5 |
| Students | 308.1 | 312.5 | 620.6 | –3.0 | –0.5 | –1.7 |
| Nursing and orphan’s allowance recipients | 10.0 | 30.8 | 40.7 | –7.5 | 10.9 | 5.8 |
| Other inactive | 89.4 | 149.0 | 238.4 | 3.6 | 0.5 | 1.6 |
| Inactive people aged 15–64 years, total | 630.3 | 1 106.8 | 1 737.1 | –5.3 | –1.9 | –3.1 |
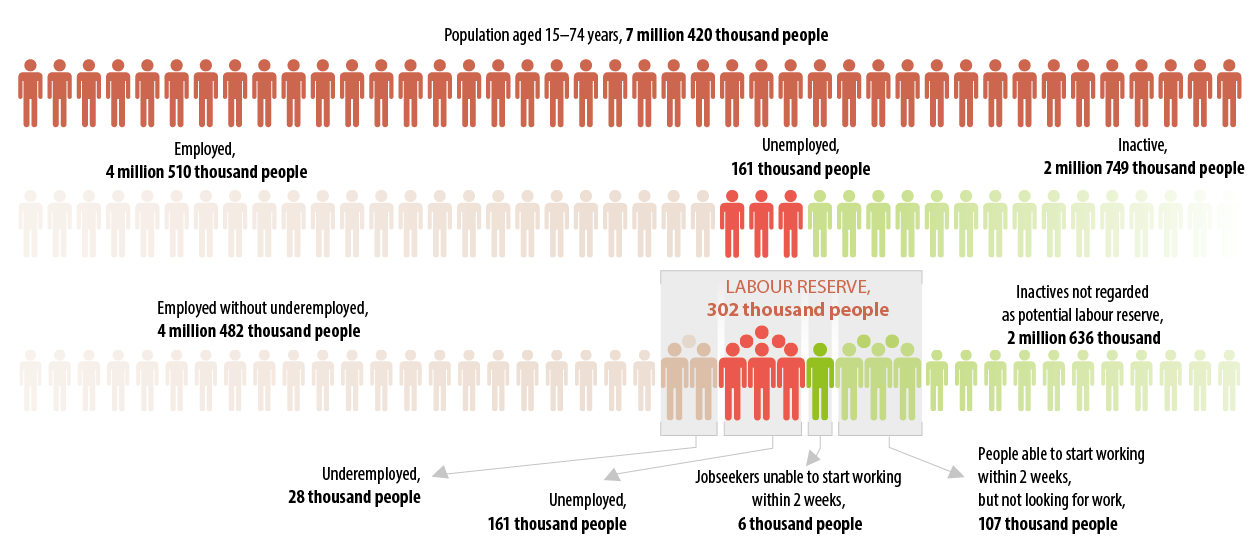
300 thousand people are in the labour reserve
The unemployed, the underemployed, the inactives who are willing to work but are not actively seeking work or who do not meet the availability criteria, together constitute the so-called potential labour reserve. This category included 302 thousand in the first three quarters of 2019, which represents a decrease of 17 thousand over a one-year period to a level significantly lower than in previous years. The decline in the labour reserve is slowing down, stagnating at around 300 thousand in the first three quarters of 2019.
More than one-third of potential labour force participants have at most basic education, another 28% have vocational education, 25% have a high school diploma and only 11% have a tertiary degree. The territorial distribution of potential manpower remains very uneven, with 24.3% coming from Northern Great Plain and 17.9% from Northern Hungary, while only 6.8% and 5.8% from Central and Western Transdanubia, i.e. from regions with more favourable labour markets.
Potential labour reserve groups by labour market attachment, Q1–Q3 2019
Average gross earnings increased by 10.8%
In the first three quarters of 2019, gross monthly earnings of full-time employees averaged HUF 359 thousand in enterprises with at least 5 employees, budgetary institutions and significant non-profit employers. This was 10.8% higher than a year ago. Following a first quarter increase of 11.0%, wage outflows slowed slightly in the second quarter to 10.3%, followed by an average growth rate of 11.4% in the third quarter, even faster than in the first quarter. Dynamic increases were supported by, among other things, an 8.0% increase both in the minimum and guaranteed minimum wages, successful wage demands by employees, wage reform of government officials, competition to retain a well-trained workforce, bonus payments and a reduction in the number of public workers.
Significant differences behind gross average earnings
In the first three quarters of 2019, gross monthly earnings of full-time employees of businesses with at least five employees averaged HUF 373,600, 11.4% higher than a year earlier. This wage outflow was 0.6 percentage points faster than the national average.
In the budgetary sphere, average gross earnings amounted to HUF 330,500 and excluding public workers to HUF 363,100. Wage growth was significantly lower than in the private sector: average wages and salaries, with and without public workers, rose by 8.5% and 6.1%, respectively.
Gross monthly earnings of full-time employees of significant non-profit employers averaged HUF 318,000 in the period under review, which is 11.5% higher than a year ago. Calculated without public workers, wages in the non-profit sector averaged HUF 336,000, along with an 8.4% wage growth rate.
Gross wages of public workers in the group observed by intra-year employment statistics averaged HUF 89,200, which was 8.2% higher than a year earlier. The increase was caused by the fact that a certain part of the public workers received a one-off grant of HUF 81,530 per beneficiary in September under a government decree, accordingly, the average monthly wage in September was HUF 148,300 for public workers covered by earnings statistics.
Average gross earnings of full-time employees by section, Q1–Q3 2019
| Section | Average gross earnings | Average gross earnings index | ||
|---|---|---|---|---|
| including public workers |
excluding public workers |
including public workers |
excluding public workers |
|
| HUF/person/month | same period last year=100.0% |
|||
| Agriculture | 282 809 | 288 515 | 113.6 | 112.0 |
| Mining | 415 142 | 415 142 | 111.6 | 111.6 |
| Manufacturing | 382 978 | 382 996 | 112.6 | 112.6 |
| Energy industry | 595 862 | 596 280 | 110.1 | 110.0 |
| Industry (without water and waste management) | 390 350 | 390 376 | 112.4 | 112.4 |
| Water and waste management | 330 081 | 335 108 | 111.5 | 110.7 |
| Industry total | 386 907 | 387 279 | 112.4 | 112.3 |
| Construction | 279 407 | 281 667 | 112.8 | 112.5 |
| Wholesale and retail trade | 337 323 | 337 330 | 112.6 | 112.5 |
| Transportation and storage | 336 071 | 337 309 | 109.1 | 108.9 |
| Accommodation services and catering | 236 530 | 236 660 | 111.4 | 111.4 |
| Information and communication | 618 004 | 618 004 | 110.6 | 110.6 |
| Financial services | 657 097 | 657 158 | 107.8 | 107.8 |
| Real estate transactions | 304 451 | 309 327 | 107.1 | 106.4 |
| Scientific and technical activities | 497 669 | 498 617 | 112.3 | 112.2 |
| Administrative services | 302 149 | 304 587 | 111.5 | 111.2 |
| Public administration | 426 378 | 438 534 | 109.8 | 108.6 |
| Education | 329 171 | 329 978 | 103.6 | 103.5 |
| Human health and social work activities | 242 755 | 308 224 | 112.1 | 106.8 |
| Art and Leisure | 350 981 | 355 799 | 110.9 | 109.1 |
| Other services | 299 097 | 304 496 | 116.5 | 110.3 |
| National economy, total | 359 885 | 369 909 | 110,8 | 109,9 |
Earnings grew above average in most sections of the economy. Excluding public workers, the manufacturing industry posted the highest earnings growth of 12.6%. Gross average earnings in construction and trade also increased significantly, by 12.5%. Wages increased by more than 12% in scientific and technical activities and agriculture. In these areas, wage developments and the raising of the minimum wage, which were intended to address the growing labour problems of the sectors, may have been behind the faster wage outflow. In the average of the first nine months of 2019, wage growth was the slowest in education. In the first three quarters of 2019, gross wages and salaries here increased by 3.5% following last year's (multi-subgroup) wage increase.
Average gross earnings (taking into account the data of public workers) exceeded half a million forints in three sections of the national economy:
- financial and insurance activities (HUF 657,100),
- information and communication (HUF 618,000),
- energy industry (HUF 595,900).
Workers in the section of accommodation and catering had the lowest average gross earnings (HUF 236,500).
In the first three quarters of 2019, men in full-time employment had 20% higher average monthly gross earnings than women. Gross income averaged HUF 393,600 for men and HUF 327,700 for women. Gross wages increased by 11.5% for men and slightly less for women (10.0%) over the year. Differences in employment characteristics also lie behind the gender gap (for example differences in composition by age, highest completed education, and length of work experience).
Earning positions are worst for the under-20s and best for the 30 to 39 year-olds when wages of employees are examined by 10 year age group. Gross income of the latter age group averaged HUF 391,100, an increase of 11.1% in nominal terms.
Non-manual workers earned an average of 74% more monthly than manual workers. Average gross earnings increased by 12.9% to HUF 264,900 for manual workers and by 9.1% to HUF 460,200 for non-manual workers over a year.
Examined in January–September 2019, by major occupational group, business, administrative, advocacy leaders and legislators had the highest gross monthly average salary. People in these jobs earned on average 3.6 times more, or 696,200 HUF, than non-skilled (ordinary) people, whose average wage was 192,100 HUF. Over the year, average wages increased by 8.4% for the former group and by 15.7% for the latter (in connection with a decrease in the number of low-wage public workers). A faster (15.9%) average wage outflow occurred in the agricultural and forestry employee group. Among manual workers, the gross average earnings of industrial and construction workers were the highest, but machine operators, assemblers, and drivers also earned an average of over HUF 300,000. The average wages of the former increased by 12.8% in one year and those of the latter by 13.3%. Within the non-manual group, the average gross earnings of office, administrative (customer relationship) employees were the lowest, their average gross earnings increased by 12.3% to HUF 316,200.
In the first nine months of 2019, earnings of full-time employees were highest in organisations headquartered in Budapest and lowest in organizations in Szabolcs-Szatmár-Bereg County (HUF 449,200 and HUF 248,900, respectively). Budapest's earnings advantage is outstanding compared to other areas due to its economic structure and the high proportion of non-manual workers. Outside the capital, the gross average earnings of full-time employees exceeded the national average in Győr-Moson-Sopron (HUF 379,100) and Fejér counties (HUF 360,800) and almost reached it in Komárom-Esztergom county (HUF 358,400). The most disadvantaged areas in terms of average earnings were the counties of Szabolcs-Szatmár-Bereg, Békés (HUF 263,500) and Nógrád (HUF 272,200). Bottom ranked counties tend to have a high proportion of public workers. As this group receives low and fixed wages, their share affects the relative wage position of the area concerned. (County wage ranking was not significantly changed by the September bonus for public workers.) Average gross earnings increased above 12% in Fejér and Győr-Moson-Sopron counties in one year, while wage increases in Vas, Nógrád and Csongrád counties were below 10%.
In the first three quarters of 2019, the average gross salary (calculated on a monthly basis without bonuses and one-month special allowances) was HUF 337,200, 10.6% higher than a year earlier.
Total and regular* gross average earnings, Q1–Q3 2019
| Denomination | Total gross average earnings | Of which: regular earnings |
|---|---|---|
| HUF/person/month | ||
| National economy, total | 359 885 | 337 240 |
| Of which: | ||
| business sector | 373 577 | 347 496 |
| budgetary sector | 330 515 | 314 634 |
| nonprofit sector | 318 006 | 309 443 |
| Same period last year = 100.0% | ||
| National economy, total | 110.8 | 110.6 |
| Of which: | ||
| business sector | 111.4 | 111.2 |
| budgetary sector | 108.5 | 108.2 |
| nonprofit sector | 111.5 | 111.1 |
*The value of regular earnings is estimated.
Net earnings increased by 10.8% and real earnings by 7.3%
In 2019, the level of personal income tax on wages and other deductions on employees did not change substantially. In January–September 2019, net earnings excluding allowances increased at the same rate of 10.8% as the gross figure to HUF 239,000 in one year. With consumer prices rising by 3.3% over the reference period, the real value of earnings rose by 7.3% at national level. (Real earnings growth was slightly higher at 7.6% in the first quarter.)
Employees may qualify for tax and contribution deductions under various titles. Such benefits include, for example, family tax breaks, first-time spouse benefits, or personal allowances for workers suffering from certain diseases. In addition, legislation provides workers with tax relief in certain cases. An example is the contribution exemption for retired workers, which came into force in 2019. In the first nine months of 2019, net average earnings, adjusted for allowances, amounted to HUF 246,700 at the national level, up 10.9% in nominal terms from a year earlier.
Decline in the share of other labour income
In the first nine months of 2019, gross monthly labour income averaged HUF 374,900. Fringe benefits averaged more than 15,000 forints a month per capita. Thus, the share of other labour income (for example, cafeteria benefit) was 4.0%. As the growth rate of labour income (10.4%) was 0.4 percentage points below the growth rate of gross earnings year-on-year, the share of other labour income decreased.
Most sections of the economy saw a decline in the ratio and a slower increase in expenditures on labour income than in gross wages as a result of a significant narrowing of the range of low-tax or tax-free fringe benefits. The share of other labour income increased only in the energy, accommodation services and catering sections during the year. Other sections were characterized by decreases between 0.2 and 1.3 percentage points.
Further information, data:
Contact details:
kommunikacio@ksh.hu
Contact us!
Telephone: (+36-1) 345-6789
www.ksh.hu