
Results of the online survey on the website services of HCSO
The aim of the survey was to get to know the satisfaction with the services provided by the HCSO website. Most people visit the HCSO website for the purpose of getting information or providing data. We wanted to know how our users behave and what they do if problems arise during searching for information or providing data on the website, as well as how satisfied they are with the current possibilities for administration and whether they are open to new solutions.
The questionnaire was accessible on the HCSO website and in the electronic data collection system (ELEKTRA) of HCSO between 17 and 31 March 2014. A total of 156 external users completed the questionnaire, 55 of them via the website and 101 via the HCSO-ELEKTRA system. Slightly more than half of the respondents (53%) came from enterprises and the representatives of the business sector. The questionnaire was completed by relatively many employees of public administration and other budgetary institutions (18%). In the analysis, the other groups were treated in an aggregate form (29%).
One fourth of the respondents visit the HCSO website weekly, another one fourth visit it about once a month, one tenth once in every two or three months and slightly more than one third at least once a year. Monthly visits are somewhat more typical and weekly visits are less typical in case of enterprises, while people working in public administration and organizations classified to other categories, especially researchers, lecturers and the media visit the website typically weekly.
According to the respondents, the aim of visiting the website is primarily data provision, which was mentioned by 110 respondents, i.e. 71% of all respondents. The role of data provision was particularly strong in case of enterprises, but it was decisive in case of public administration and other budgetary institutions as well. In case of other organizations, general orientation, download of data and obtaining information were similarly important motivations.
To the question ‘Do you easily find the searched data, forms, programs and information on our website?’, two thirds of all respondents indicated the intermediate response category ‘In most cases yes’.
Among strategies for solving data interpretation or technical problems, the most typical is that the user calls the central phone number or the direct number of the expert if it is known (51%). It is much less frequent when the user indicates the problem via e-mail (18%). One tenth of the respondents give up the attempts and try perhaps with other data sources, while two tenths of them usually do not have such problems, e.g. because they do not use the website, only provide data, in which they have an easy way around.
The sub-menu ‘Frequently asked questions’ (only in Hungarian) is known and used by nearly one third of respondents, slightly more than one third of them know it, but do not use it as they usually do not find there a solution to their problem and another one third of respondents do not know it at all.
One third of the respondents know the possibility for reporting immediately problems and claims on the web, i.e. the helpdesk and they consider it a modern solution, one sixth of them do not know it, but, based on its description, they think it is cost-effective, while one fourth of them do not know it but would like to try it.
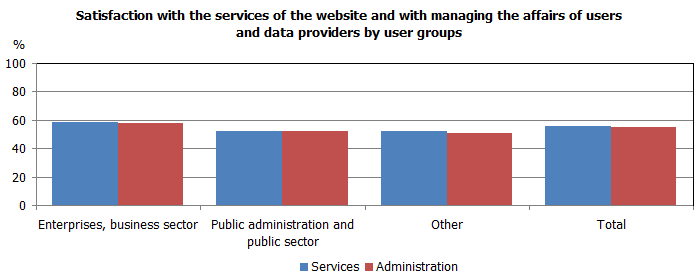
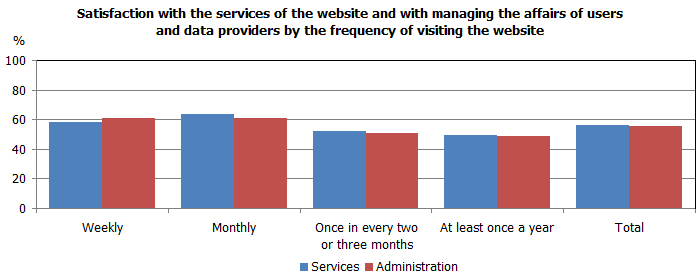
The satisfaction with the services of the website and with managing the affairs of users and data providers was quite similar, 56% each.
The results of the survey were taken into account in the development of the Contact Center and Knowledge Base (e.g. preparing specifications) within the EKOP 2A2 project (‘Development of the HCSO Portal, electronic data collection service and operational infrastructure’).
Tables
| Table 1: Respondents by user groups | Persons | Distribution, % |
|---|---|---|
| Enterprises, business sector | 82 | 52.6 |
| Public administration and public sector | 28 | 17.9 |
| Researcher, student, lecturer | 12 | 7.7 |
| NGO | 5 | 3.2 |
| Media, press | 2 | 1.3 |
| Private individual | 11 | 7.1 |
| Other | 16 | 10.3 |
| Total | 156 | 100.0 |
| Table 2: Frequency of visiting the website | Persons | Distribution, % |
|---|---|---|
| Weekly | 39 | 25.7 |
| Monthly | 42 | 27.6 |
| In every two or three months | 17 | 11.2 |
| At least once a year | 54 | 35.5 |
| Total | 152 | 100.0 |
| Table 3: Distribution of search efficiency | Persons | Distribution, % |
|---|---|---|
| Always finds easily | 35 | 23.3 |
| Finds in most cases | 99 | 66.0 |
| Asks for the help of HCSO colleagues | 16 | 10.7 |
| Total | 150 | 100.0 |
| Table 4: Way of solving data interpretation or technical problems | Persons | Distribution, % |
|---|---|---|
| Calls the central phone number or the given expert | 78 | 50.6 |
| Indicates the problem via e-mail | 27 | 17.5 |
| Visits the office, arranges the problem personally | 1 | 0.6 |
| Gives up, does not keep trying | 16 | 10.4 |
| Usually does not have a problem | 32 | 20.8 |
| Total | 154 | 100.0 |
| Table 5: Use of ‘Frequently asked questions’ | Persons | Distribution, % |
|---|---|---|
| Uses it | 48 | 31.6 |
| Knows it but does not use it | 54 | 35.5 |
| Does not know it, therefore does not use it | 50 | 32.9 |
| Total | 152 | 100.0 |
| Table 6: Knowledge of the possibility for reporting immediately problems and claims on the web (helpdesk) | Persons | Distribution, % |
|---|---|---|
| Knows it and considers it a modern solution | 43 | 28.9 |
| Thinks it is good and cost-effective but does not know it | 24 | 16.1 |
| Does not know it but is open to it and would try it | 35 | 23.5 |
| Does not have internet access at home/at work, uses the website at an eHungary point | 43 | 28.9 |
| Other | 4 | 2.7 |
| Total | 149 | 100.0 |