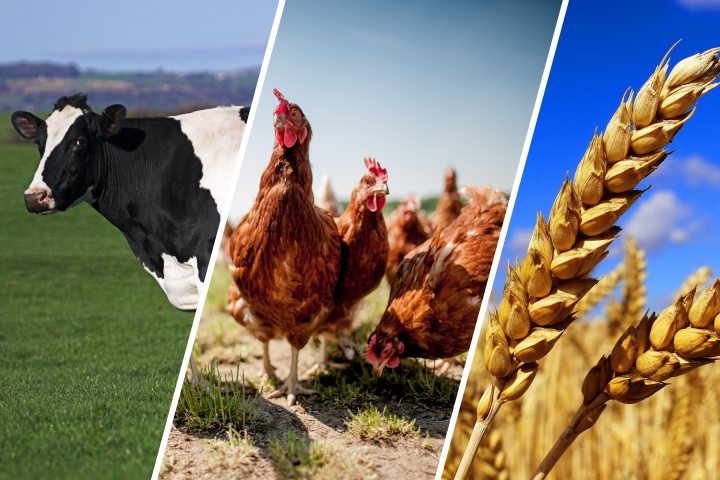
Agriculture
Agricultural statistics aims at assessing the performance of agriculture. In connection with crop production the statistical domain takes account of the utilisation, rent and sales price of productive land, and the sales of produced products. It also includes data on livestock and the production and sales of animal products. The effects of agriculture on the environment are substantially influenced by the technology used in production, so the statistical domain covers data for example on organic farming and the use of plant protection chemicals. A farm structure survey as well is made at intervals of several years, in which the number, size and labour input of holdings are surveyed.
Key figures
Share of agriculture, forestry and fishing of gross value added
Indicator description
Agriculture, forestry and fishing section as a share of gross value added.
Source of data:
Summary Tables (STADAT)
Last data for period: 2024
Agricultural terms of trade
Indicator description
Agricultural producer price index divided by agricultural input price index, compared to the previous year.
Source of data:
Summary Tables (STADAT)
Last data for period: 2025
Change in annual rent for arable land, compared to previous year
Indicator description
Average of rent paid by leaseholders to landowners for use, weighted with the leased area. The indicator shows changes in land rents in forints compared to the previous year.
Source of data:
Summary Tables (STADAT)
Last data for period: 2024
Change in net entrepreneurial income in agriculture
Indicator description
Net entrepreneurial income measures the income from agricultural activities which can be spent on the remuneration of own factors of production – i.e. unpaid work (carried out by family members), plot of land owned by the agricultural holding and own capital. It is the income equal to net value added less compensation of employees, other taxes on production, rents and interest expenditures, plus other subsidies on production and interest revenues.
Source of data:
Summary Tables (STADAT)
Last data for period: 2025
Featured
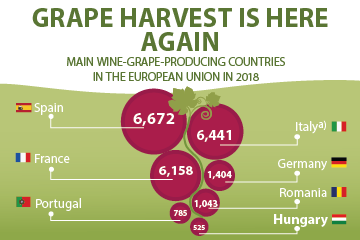
Snapshots, 2025 – Agriculture
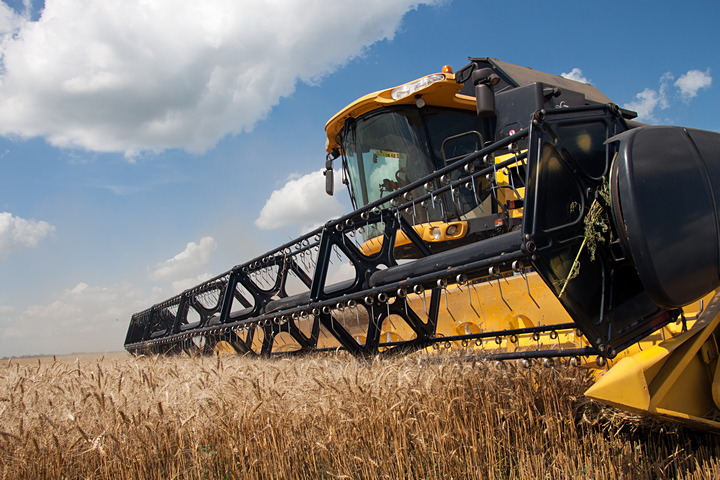
According to preliminary data, Hungary’s agriculture accounted for 2.7% of the gross value added of the economy in 2025, which was higher than the 1.6% EU average. A total of 11.8 million tonnes of cereals, 770 thousand tonnes less than in the base period, were harvested on an area similar to that in 2024 (2.2 million hectares). Hungary was the second largest sunflower producer in the EU: its production of 1.7 million tonnes made up a fifth of the EU’s total production.
Day of Szeged
The free royal city of Szeged received its charter from King Charles III on 21 May 1719: this date has been celebrated as the city’s official day since 1990. In 1962, it became the seat of the then Csongrád County. Today it is the second most populous city outside Budapest. It is a cultural, educational, and economic centre. Its theatre, the Szeged Open-Air Festival, and its higher education institutions all have a long and distinguished history. In recent decades, its economy has shifted from the food industry—paprika, Pick salami, and its canning factory—toward vehicle manufacturing.
Day of Bees, 30 April
Since 2018, the United Nations has designated 20 May as World Bee Day to highlight the importance of beekeeping and the long standing, ever evolving relationship between humans and bees. The date is no coincidence: it marks the birthday of Anton Janša, a pioneer of modern apiculture. In Hungary, the Day of the Bees has been observed on 30 April since 1994 at the initiative of the National Hungarian Beekeeping Association, as this is the time when life in the hive begins to intensify. Bees are valuable not only for honey production; their pollination activity significantly influences the success of fruit cultivation.

International Day of Forests
Since 2013, at the initiative of the United Nations, the International Day of Forests has been celebrated on 21 March, the first day of astronomical spring. The theme of the 2026 event is „Forest and economies”, highlighting roles that go beyond nature conservation, including energy and raw material production as well as the provision of jobs (and thus income). By the end of 2024, the forest area in Hungary had expanded to a century long record of 1.96 million hectares. Timber harvested from Hungarian forests was used in nearly equal proportions for industrial purposes and as firewood.
Total value of output of agriculture grows by 6.2%, Performance of agriculture, 2025 (first estimate)
The output of agriculture was above 4.4 thousand billion forints in 2025, which was 6.2% more than a year earlier. The contributors to the growth were a 10% rise in the total producer price level and a 2.5% increase in the volume of livestock production. The volume of output fell by 3.6% in agriculture, within which by 8.7% in crop production.
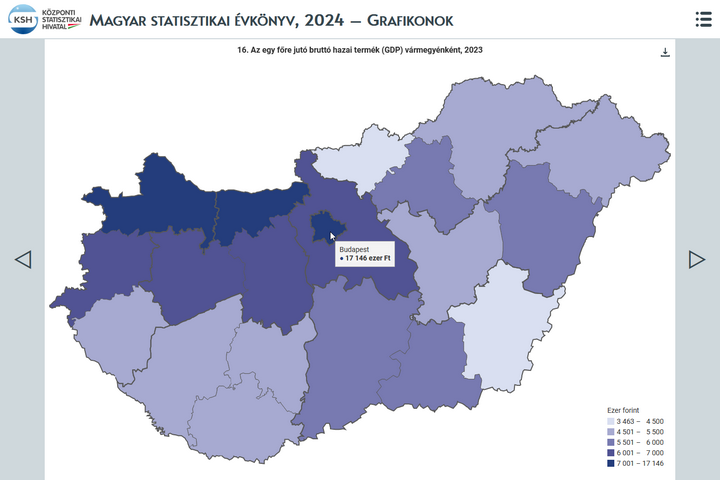
Statistical Yearbook of Hungary, 2024
The yearbook provides an overview of Hungary's demographic, social and economic trends, environmental characteristics and their changes over time, with the help of tens of thousands of data in some 500 tables, charts and maps. In the chapter devoted to earnings and incomes, it is a novelty compared to previous years that net earnings in which allowances and types of exemptions are accounted for, too, came into focus from 2019. In the number of employees, people working in working time shorter than 60 working hours per month are also taken into account. In addition, the theme of environment is completed with areas declared world heritage sites by UNESCO.

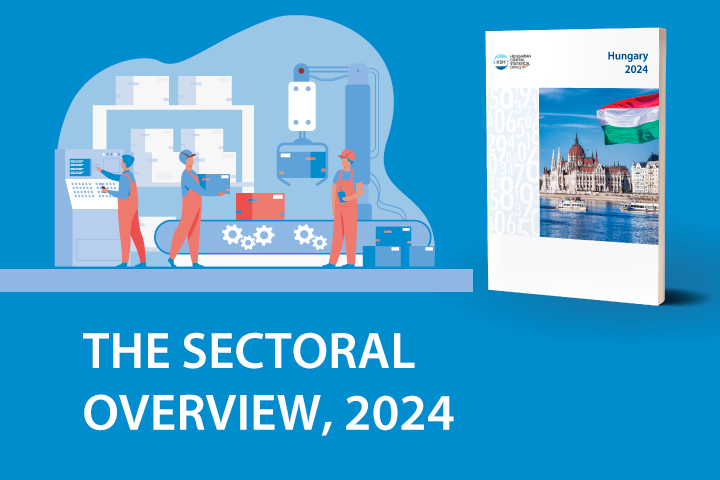
Hungary, 2024
Hungary’s GDP increased by 0.5% amid global challenges in 2024. The performance of goods-producing industries lessened, while that of service-providing ones rose, which shows the duality of economic trends. Household consumption picked up, which was considerably encouraged by the purchasing power of earnings growing again with the inflationary wave calming down. Besides, the data series reveal that the level of employment reached another peak.
Performance of domestic agriculture in 2022 – (Economic accounts for agriculture, 2022)
The output of agriculture exceeded 4 thousand billion forints in Hungary in 2022, which was 19% higher than a year earlier. The growth was due to a 44% increase in prices. Owing to the weather with little precipitation, there was a decrease in the harvest of all crops, and a significant rise in expenditure hindered the performance of livestock production, too. Hungary made up 1.9% of the EU’s agricultural output. The net amount of subsidies on domestic production was 809 billion forints.
Related themes
Methodological information
Related links
First releases |
Latest release | Next release |
|---|---|---|
| Performance of agriculture, 2025 (first estimate) | 05/12/2025 | 04/12/2026 |
Release and revision calendarPublication repertory
Census data |
Census |
|---|---|
| Integrated Farm Statistics data collection – IFS 2023, finalised data | IFS 2023 – Integrated Farm Statistics data collection |
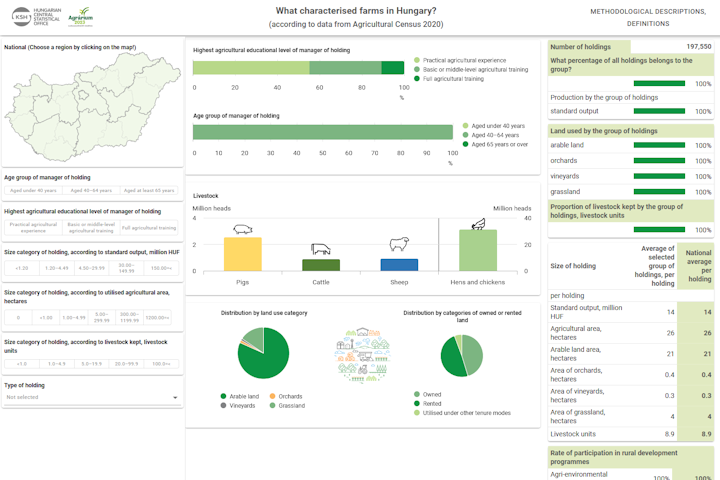
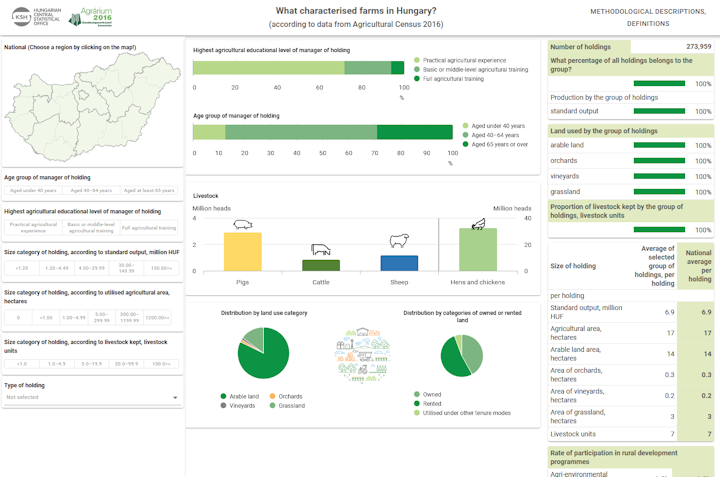
| What characterised farms in Hungary? | IFS 2023 – Integrated Farm Statistics data collection |
| Integrated Farm Statistics data collection – IFS 2023, preliminary data | IFS 2023 – Integrated Farm Statistics data collection |
| Hungarian agriculture in numbers | Agricultural census – FSS 2020 |
| Publications of Farm Structure Survey – Excel tables | Agricultural census – FSS 2020 |
| Farm structure data for agriculture (e.g. used land area, livestock, labour force) | Agricultural census – FSS 2016 |
Data visualisations