Time use
The goal of the time use data collection is to present data regarding time use of the population. It’s purpose is the support of establishing family policy, to help forming policy on working hours, to provide information on travel destinations and modalities, on cultural and leisure time activities, to assist work related to the development of national accounts, within this mainly on production within the households. The tool of the time use survey is the time use diary which contains the activities performed during the 24 hours of the day and the average time spent on them in sequence of events.
Key figures
Average time spent on income generating and productive activities
Indicator description
The average daily time spent by the population aged 15–74 on income generating and productive activities in minutes. In other words, it shows how many minutes a person in the given age group spent on the given activity on an average day.
Source of data:
Summary Tables (STADAT)
Last data for period: 2024/2025 preliminary
Average time spent on housework, work around the house
Indicator description
The average daily time spent by the population aged 15–74 on housework, work around the house in minutes. It shows how many a person in the given age group spent on the given activity on an average day.
Source of data:
Summary Tables (STADAT)
Last data for period: 2024/2025 preliminary
Average time spent on child care, providing for children
Indicator description
The average daily time spent by the population aged 15–74 on child care, providing for children in minutes. It shows how many minutes the population in the given age group spent on the given activity on an average day.
Source of data:
Summary Tables (STADAT)
Last data for period: 2024/2025 preliminary
Average time spent on leisure activities
Indicator description
The average daily time spent by the population aged 15–74 on leisure activities in minutes. It shows how many minutes a person in the given age group spent on the given activity on an average day.
Source of data:
Summary Tables (STADAT)
Last data for period: 2024/2025 preliminary
Featured

Snapshots, 2024 - Time use
After 15 years the HCSO conducted a time use survey: a comprehensive picture has been obtained during the 2024/2025 data collection about the time management of the Hungarian population aged 15 to 74. According to preliminary data time spent on socially fixed activities (work, learning, chores) grew on average to 8.5 hours per day, and to 4.8 hours, also more than before, on leisure activities. Now, average physiologically fixed activities (eating, sleeping, hygiene) decreased to the lowest level measured up until now (10.7 hours).
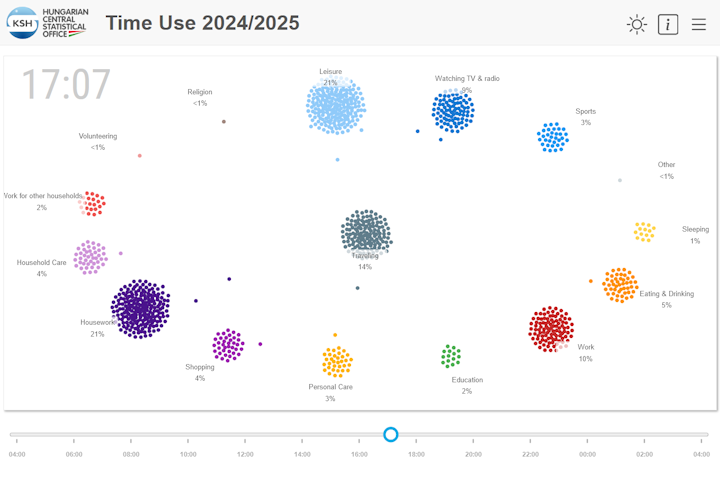
Time Use Survey 2024/2025
The Time Use Survey serves, among other things, to analyse the different time use patterns of various social and demographic groups. The Hungarian Central Statistical Office (HCSO) conducted the survey between April 2024 and April 2025 among the population aged 10–84 living in private households. The animation, which utilizes the data from the 2024/2025 survey, illustrates the activity breakdown of an average day for a 1,000-person sample population.
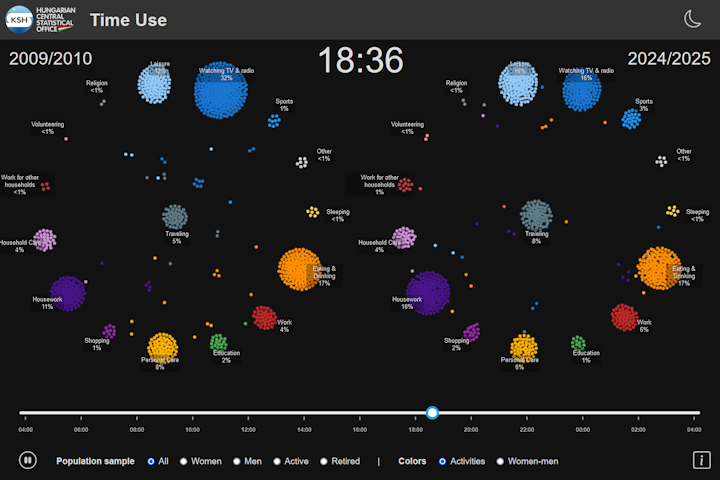
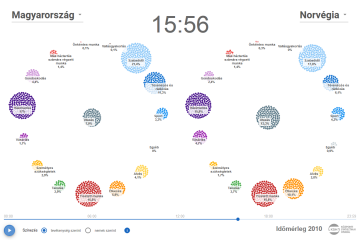
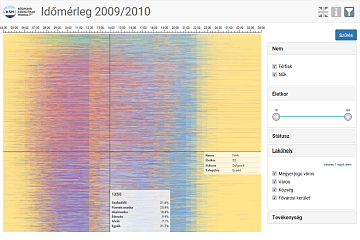
Time Use Survey 2024/2025 and 2009/2010
The Time Use Survey serves, among other things, to analyse the different time use patterns of various social and demographic groups. The chart, which is based on data from the most recent 2024/2025 Time Use Survey and the one immediately preceding it from 2009/2010, illustrates an average day, broken down by activities, for a sample population of one thousand individuals from each respective period.
Related themes
- Culture, sports
- Income and consumption
- Labour
- Living conditions
- Men and women
- The young and the elderly
Methodological information
Dissemination database ( infra-annual data annual data ) |
Latest update | Next update |
|---|---|---|
Time use | ||
| Change of time use of the population, 1986-2000 | 11/09/2009 | – |
Data visualisations