
INSPIRE – Agricultural and aquaculture facilities
Description of spatial data theme
Agricultural and aquaculture facilities: farming equipment and production facilities (including irrigation systems, greenhouses and stables).
Spatial data
Data on the number of holdings and on agricultural labour force, coming from the 2010 agricultural census, can be classified to this spatial data theme. The data were depicted on grid maps. On these the area of Hungary is divided by a 25 km² grid and not by administrative borders, and the colour of the grid cells is growing darker with the increase in the absolute number of the data they contain. This is made possible by the identification of holdings according to their headquarters by EOV co-ordinates.
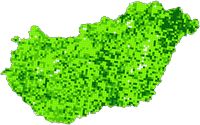 Number of holdings per 25 km² (holding density), 2010
The area of Hungary is covered by a 25 km² grid, and the colour of the grid cells is directly proportional to the number of the holdings they contain. In 2010, 577 thousand holdings were registered in the agricultural census, nearly 568 thousand of which were private holdings and somewhat more than 9 thousand were agricultural enterprises. Therefore, the spatial distribution of holdings is basically determined by the location of private holdings. The value is high in the axis between the agglomeration of Budapest and Szeged, and in Szabolcs-Szatmár-Bereg County. In these areas a high proportion of vegetable and fruit production is typical.
Download map » (pdf, 1 239 KB) Download data » (xlsx, 123 KB) Download metadata » (xls, 38 KB)
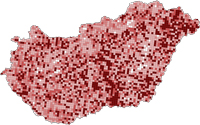 Annual work units per 25 km², 2010
The area of Hungary is covered by a 25 km² grid, and the colour of the grid cells is directly proportional to agricultural labour input, expressed in annual work units (1 AWU=1,800 hours), in the holdings they contain. In 2010, according to data of the agricultural census, the agricultural activities of non-salaried labour force and permanent employees took the time of 403 thousand people working full-time through the whole year (the map does not show seasonal labour force). Labour density shows a similar picture to that of holding density. Labour input is relatively high in labour intensive sectors, such as vegetable and fruit production, therefore, darker spots can be seen on the central and northeastern areas of the Great Plain.
Download map » (pdf, 656 KB) Download data » (xlsx, 136 KB) Download metadata » (xls, 38 KB)