
Regional Atlas – Cities of Europe – Urban audit
There is a growing demand for an assessment of the quality of life offered by European cities, as almost three-quarters of European Union citizens live there. Comparison of the functioning of cities on regional, national and European scale, cross-checking of some cities, as well as the uncovering of their disparities is not only useful but it is crucial for political decision making purposes. This is the reason why it is inevitable to have as much and as detailed data as possible about the European cities.
Since its first collection at the end of the 1990s in the form of a pilot project, which has since been followed by several data collection rounds mainly executed by the National Statistical Institutes (NSIs), the City Statistics data collection has always been subject to modifications due to evident political demand (e.g. Europe 2020 strategy, the revision of the General Regulation for the European Regional Development Fund) and progress in the European Statistical System (ESS).
The method has been improved by Eurostat on several occasions in cooperation with DG Regional and Urban Policy (DG REGIO) and the responsible institutions in the participating countries (mainly NSIs). These improvements have led to significant changes in the collection of data. They were on the one hand of qualitative and on the other of quantitative nature. With regards to the quality aspects, mainly the methods for the collection of individual variables have been harmonised allowing the comparison of different cities’ data. On the quantitative side, the number of cities and variables collected increased from one data collection round to the next.
In 1999, the Commission (DG REGIO) conducted a tentative data collection of comparable variables and indicators for European cities. The purpose of this data collection was to test the feasibility of collecting comparable measurements of the quality of life in European cities. Over the entire EU (EU-15 at the time), around 480 variables were collected for the 58 largest cities – although London and Paris were omitted since they were considered too difficult to cope with in a test phase.
After completion of this pilot exercise, the Commission decided that there was a clear need to continue and improve this approach of collecting comparable information on urban development. However, it was felt that Eurostat and the European Statistical System (ESS) should organise the data collection and use the know-how of its experts in statistics.
The data collections covered over 300 variables across a wide range of economic, demographic and social topics. The variables changed from wave to wave reflecting past experience and evolving policy needs. A small set of variables were collected for 1991 and 1996 and a few variables were also collected annually for the reference years 2005 and onwards. In the 2014/2015 data collection phase around 100 variables were collected for the reference years 2013 and 2014. In 2016, work started on further improvements to the variables list, taking into consideration the indicators defined for the Sustainable Development Goals.
To some extent, the geographical scope also changed between data collection waves. Overall, it covered cities in the EU-28, plus cities in Norway, Switzerland and Turkey.
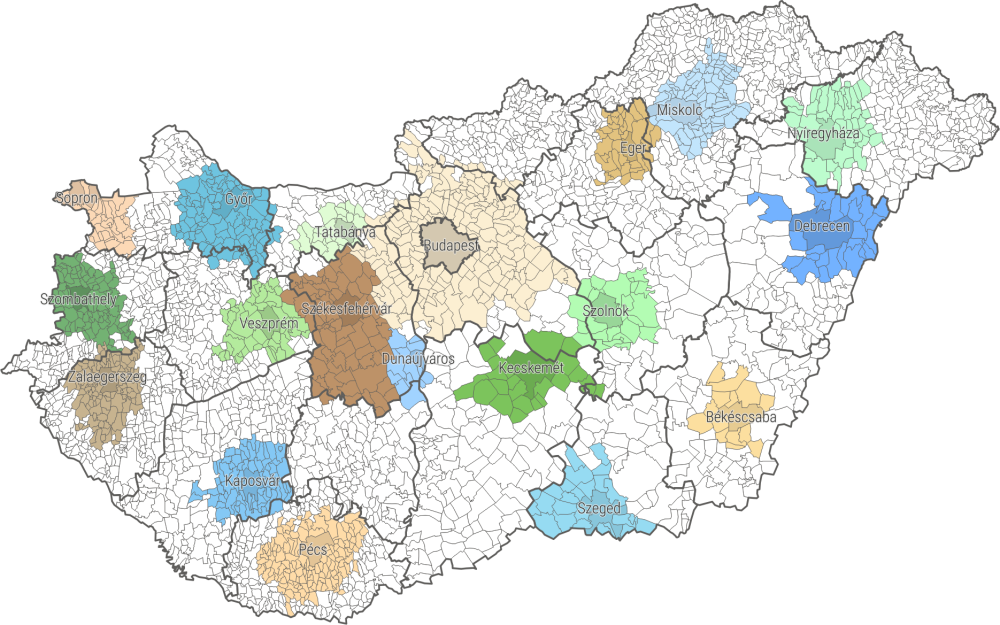
From the 346 cities in Hungary, the capital city and 18 cities of county rank plus their functional urban areas are involved in the Urban audit.
| Name of the functional urban area | Number of settlements | Total population (persons) | Dwelling stock (Pieces) | Number of registered job-seekers (persons) | Name of the city | Total population (persons) | Dwelling stock (Pieces) | Number of registered job-seekers (persons) |
|---|---|---|---|---|---|---|---|---|
| Békéscsaba | 15 | 111,341 | 54,650 | 4,530 | Békéscsaba | 58,654 | 29,536 | 1,891 |
| Budapest | 199 | 3,014,944 | 1,412,092 | 48,587 | Budapest | 1,750,216 | 930,714 | 26,963 |
| Debrecen | 26 | 325,714 | 146,122 | 12,705 | Debrecen | 201,112 | 98,493 | 5,801 |
| Dunaújváros | 14 | 85,463 | 40,699 | 2,790 | Dunaújváros | 43,310 | 23,070 | 1,488 |
| Eger | 37 | 98,314 | 47,382 | 3,742 | Eger | 51,894 | 26,768 | 1,621 |
| Győr | 93 | 259,424 | 111,254 | 2,663 | Győr | 133,946 | 62,924 | 1,411 |
| Kaposvár | 75 | 107,157 | 48,778 | 3,386 | Kaposvár | 60,656 | 29,450 | 1,525 |
| Kecskemét | 24 | 186,872 | 87,045 | 5,049 | Kecskemét | 110,373 | 52,206 | 2,730 |
| Miskolc | 80 | 283,706 | 126,874 | 13,487 | Miskolc | 152,901 | 77,352 | 5,467 |
| Nyíregyháza | 43 | 233,623 | 98,117 | 8,592 | Nyíregyháza | 116,814 | 53,156 | 2,454 |
| Pécs | 134 | 245,194 | 117,181 | 8,632 | Pécs | 141,843 | 73,400 | 4,045 |
| Sopron | 33 | 102,355 | 44,611 | 1,167 | Sopron | 63,065 | 29,233 | 776 |
| Szeged | 27 | 242,326 | 120,012 | 4,168 | Szeged | 160,258 | 82,959 | 2,609 |
| Székesfehérvár | 70 | 271,674 | 116,339 | 5,980 | Székesfehérvár | 96,529 | 45,950 | 1,633 |
| Szolnok | 25 | 157,174 | 74,097 | 6,114 | Szolnok | 70,554 | 35,070 | 2,394 |
| Szombathely | 86 | 148,880 | 64,884 | 3,031 | Szombathely | 78,591 | 36,138 | 1,663 |
| Tatabánya | 20 | 139,228 | 61,239 | 2,707 | Tatabánya | 66,141 | 30,968 | 1,227 |
| Veszprém | 51 | 134,317 | 58,266 | 2,643 | Veszprém | 59,119 | 27,362 | 891 |
| Zalaegerszeg | 109 | 107,182 | 49,552 | 2,921 | Zalaegerszeg | 56,722 | 26,427 | 1,313 |
Data about cities and their functional urban areas in Hungary involved in the Urban audit are available in the Dissemination database, under the Regional statistics theme, in the following two databases: Data of functional urban areas (Urban audit) and Data of urban area centrum (Urban audit).
Data about European cities and their functional urban areas involved in the Urban audit are available on the webpage of Eurostat, under Data / Database / Database by themes / General and Regional Statistics / Urban Audit theme.
A detailed methodological handbook about the data collection is available on the website of Eurostat: https://ec.europa.eu/eurostat/web/products-manuals-and-guidelines/-/KS-GQ-17-006