
Regional Atlas – Interactive Visualising Mapping Application
The Interactive Visualising Mapping Application allows the comparison of territorial characteristics of the main statistical indices. The online app provides the possibility of representing territorial data on maps, data queries and accessing methodological information relating to these data. The timely comparability of data is granted as the time series contain data registered by a uniform methodology. The overwhelming majority of downloadable and representable data is available starting from 2012, furthermore indices based on data of Farm structure survey 2010, Orchard survey 2017, Agricultural Census 2020, Vineyards of vine regions 2020 and the 2011 Census are accessible within the app. These indices appear according to the public administration structure of the latest available year in a uniform manner.
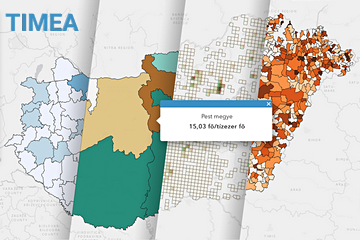
Map representations are basically possible on four – regional, county, district and settlement – territorial levels, however in case of certain indices it is possible to draw a more detailed map than the settlement-level one: a so-called graticule-map as well. Labels and base map layers may be assigned to maps containing settlement boundaries (for example aerial photo, OpenStreetMap).